- South Korea
- /
- Commercial Services
- /
- KOSE:A012750
Four Days Left To Buy S-1 Corporation (KRX:012750) Before The Ex-Dividend Date

S-1 Corporation (KRX:012750) is about to trade ex-dividend in the next four days. Investors can purchase shares before the 29th of December in order to be eligible for this dividend, which will be paid on the 17th of April.
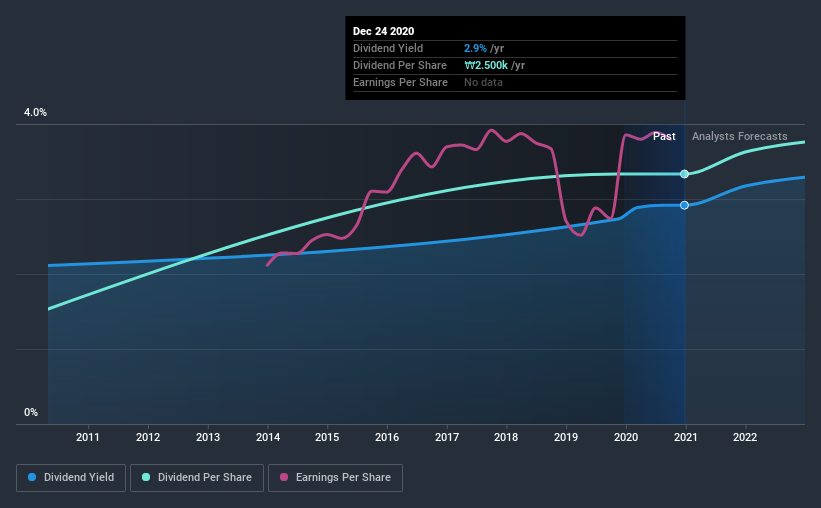
S-1's upcoming dividend is ₩2,500 a share, following on from the last 12 months, when the company distributed a total of ₩2,500 per share to shareholders. Based on the last year's worth of payments, S-1 stock has a trailing yield of around 2.9% on the current share price of ₩85700. We love seeing companies pay a dividend, but it's also important to be sure that laying the golden eggs isn't going to kill our golden goose! That's why we should always check whether the dividend payments appear sustainable, and if the company is growing.
Check out our latest analysis for S-1
Dividends are typically paid out of company income, so if a company pays out more than it earned, its dividend is usually at a higher risk of being cut. S-1 is paying out an acceptable 59% of its profit, a common payout level among most companies. Yet cash flows are even more important than profits for assessing a dividend, so we need to see if the company generated enough cash to pay its distribution. It paid out more than half (66%) of its free cash flow in the past year, which is within an average range for most companies.
It's positive to see that S-1's dividend is covered by both profits and cash flow, since this is generally a sign that the dividend is sustainable, and a lower payout ratio usually suggests a greater margin of safety before the dividend gets cut.
Click here to see the company's payout ratio, plus analyst estimates of its future dividends.

Have Earnings And Dividends Been Growing?
Companies with consistently growing earnings per share generally make the best dividend stocks, as they usually find it easier to grow dividends per share. If earnings decline and the company is forced to cut its dividend, investors could watch the value of their investment go up in smoke. This is why it's a relief to see S-1 earnings per share are up 8.5% per annum over the last five years. Decent historical earnings per share growth suggests S-1 has been effectively growing value for shareholders. However, it's now paying out more than half its earnings as dividends. Therefore it's unlikely that the company will be able to reinvest heavily in its business, which could presage slower growth in the future.
Another key way to measure a company's dividend prospects is by measuring its historical rate of dividend growth. S-1 has delivered an average of 8.1% per year annual increase in its dividend, based on the past 10 years of dividend payments. We're glad to see dividends rising alongside earnings over a number of years, which may be a sign the company intends to share the growth with shareholders.
The Bottom Line
From a dividend perspective, should investors buy or avoid S-1? Earnings per share have been growing modestly and S-1 paid out a bit over half of its earnings and free cash flow last year. All things considered, we are not particularly enthused about S-1 from a dividend perspective.
Ever wonder what the future holds for S-1? See what the five analysts we track are forecasting, with this visualisation of its historical and future estimated earnings and cash flow
We wouldn't recommend just buying the first dividend stock you see, though. Here's a list of interesting dividend stocks with a greater than 2% yield and an upcoming dividend.
If you decide to trade S-1, use the lowest-cost* platform that is rated #1 Overall by Barron’s, Interactive Brokers. Trade stocks, options, futures, forex, bonds and funds on 135 markets, all from a single integrated account. Promoted
If you're looking to trade S-1, open an account with the lowest-cost platform trusted by professionals, Interactive Brokers.
With clients in over 200 countries and territories, and access to 160 markets, IBKR lets you trade stocks, options, futures, forex, bonds and funds from a single integrated account.
Enjoy no hidden fees, no account minimums, and FX conversion rates as low as 0.03%, far better than what most brokers offer.
Sponsored ContentNew: Manage All Your Stock Portfolios in One Place
We've created the ultimate portfolio companion for stock investors, and it's free.
• Connect an unlimited number of Portfolios and see your total in one currency
• Be alerted to new Warning Signs or Risks via email or mobile
• Track the Fair Value of your stocks
This article by Simply Wall St is general in nature. It does not constitute a recommendation to buy or sell any stock, and does not take account of your objectives, or your financial situation. We aim to bring you long-term focused analysis driven by fundamental data. Note that our analysis may not factor in the latest price-sensitive company announcements or qualitative material. Simply Wall St has no position in any stocks mentioned.
*Interactive Brokers Rated Lowest Cost Broker by StockBrokers.com Annual Online Review 2020
Have feedback on this article? Concerned about the content? Get in touch with us directly. Alternatively, email editorial-team (at) simplywallst.com.
About KOSE:A012750
S-1
Provides safety and security services in South Korea and internationally.
Flawless balance sheet, undervalued and pays a dividend.
Market Insights
Community Narratives


