
Advertisement

Warren Buffett famously said, 'Volatility is far from synonymous with risk.' So it seems the smart money knows that debt - which is usually involved in bankruptcies - is a very important factor, when you assess how risky a company is. We note that SK Square Co., Ltd. (KRX:402340) does have debt on its balance sheet. But the real question is whether this debt is making the company risky.
When Is Debt Dangerous?
Debt and other liabilities become risky for a business when it cannot easily fulfill those obligations, either with free cash flow or by raising capital at an attractive price. If things get really bad, the lenders can take control of the business. However, a more common (but still painful) scenario is that it has to raise new equity capital at a low price, thus permanently diluting shareholders. Of course, plenty of companies use debt to fund growth, without any negative consequences. The first step when considering a company's debt levels is to consider its cash and debt together.
View our latest analysis for SK Square
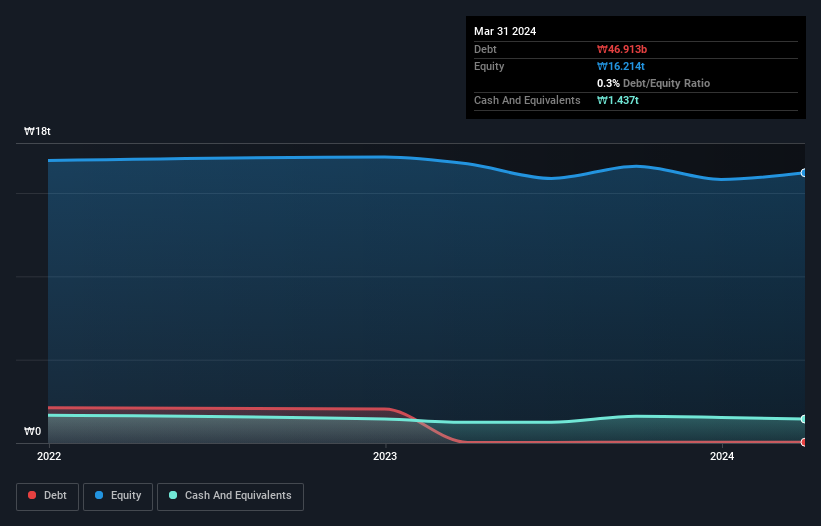
What Is SK Square's Debt?
You can click the graphic below for the historical numbers, but it shows that as of March 2024 SK Square had ₩46.9b of debt, an increase on ₩34.8b, over one year. However, its balance sheet shows it holds ₩1.44t in cash, so it actually has ₩1.39t net cash.
How Healthy Is SK Square's Balance Sheet?
We can see from the most recent balance sheet that SK Square had liabilities of ₩1.27t falling due within a year, and liabilities of ₩791.8b due beyond that. Offsetting this, it had ₩1.44t in cash and ₩547.3b in receivables that were due within 12 months. So its liabilities total ₩80.2b more than the combination of its cash and short-term receivables.
Having regard to SK Square's size, it seems that its liquid assets are well balanced with its total liabilities. So while it's hard to imagine that the ₩14t company is struggling for cash, we still think it's worth monitoring its balance sheet. Despite its noteworthy liabilities, SK Square boasts net cash, so it's fair to say it does not have a heavy debt load! When analysing debt levels, the balance sheet is the obvious place to start. But ultimately the future profitability of the business will decide if SK Square can strengthen its balance sheet over time. So if you're focused on the future you can check out this free report showing analyst profit forecasts.
In the last year SK Square had a loss before interest and tax, and actually shrunk its revenue by 40%, to ₩1.1t. To be frank that doesn't bode well.
So How Risky Is SK Square?
Although SK Square had an earnings before interest and tax (EBIT) loss over the last twelve months, it generated positive free cash flow of ₩53b. So taking that on face value, and considering the net cash situation, we don't think that the stock is too risky in the near term. Until we see some positive EBIT, we're a bit cautious of the stock, not least because of the rather modest revenue growth. When analysing debt levels, the balance sheet is the obvious place to start. However, not all investment risk resides within the balance sheet - far from it. These risks can be hard to spot. Every company has them, and we've spotted 1 warning sign for SK Square you should know about.
If, after all that, you're more interested in a fast growing company with a rock-solid balance sheet, then check out our list of net cash growth stocks without delay.
New: Manage All Your Stock Portfolios in One Place
We've created the ultimate portfolio companion for stock investors, and it's free.
• Connect an unlimited number of Portfolios and see your total in one currency
• Be alerted to new Warning Signs or Risks via email or mobile
• Track the Fair Value of your stocks
Have feedback on this article? Concerned about the content? Get in touch with us directly. Alternatively, email editorial-team (at) simplywallst.com.
This article by Simply Wall St is general in nature. We provide commentary based on historical data and analyst forecasts only using an unbiased methodology and our articles are not intended to be financial advice. It does not constitute a recommendation to buy or sell any stock, and does not take account of your objectives, or your financial situation. We aim to bring you long-term focused analysis driven by fundamental data. Note that our analysis may not factor in the latest price-sensitive company announcements or qualitative material. Simply Wall St has no position in any stocks mentioned.
Have feedback on this article? Concerned about the content? Get in touch with us directly. Alternatively, email editorial-team@simplywallst.com
About KOSE:A402340
SK Square
Invests in semiconductor, and information and communication technologies in South Korea, China, Asia, the United States, and Europe.
Very undervalued with excellent balance sheet.
Market Insights

Advertisement
Community Narratives

BMW cruising ahead with new EVs and premium models to boost revenue 5%
Fair Value €135.07|45.0% undervalued
UN
Community Contributor
EU#2 - From Humble Beginnings to Global Powerhouse
Fair Value DKK 851.04|48.9% undervalued
TO
Community Contributor