
Advertisement

David Iben put it well when he said, 'Volatility is not a risk we care about. What we care about is avoiding the permanent loss of capital.' So it seems the smart money knows that debt - which is usually involved in bankruptcies - is a very important factor, when you assess how risky a company is. We can see that SK Square Co., Ltd. (KRX:402340) does use debt in its business. But should shareholders be worried about its use of debt?
Why Does Debt Bring Risk?
Debt assists a business until the business has trouble paying it off, either with new capital or with free cash flow. If things get really bad, the lenders can take control of the business. While that is not too common, we often do see indebted companies permanently diluting shareholders because lenders force them to raise capital at a distressed price. Of course, plenty of companies use debt to fund growth, without any negative consequences. The first step when considering a company's debt levels is to consider its cash and debt together.
View our latest analysis for SK Square
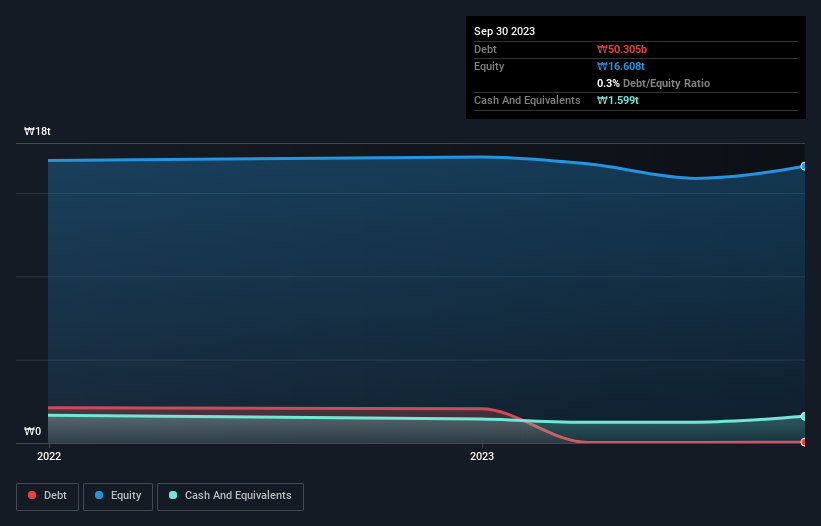
What Is SK Square's Debt?
The image below, which you can click on for greater detail, shows that SK Square had debt of ₩50.3b at the end of September 2023, a reduction from ₩2.05t over a year. However, it does have ₩1.60t in cash offsetting this, leading to net cash of ₩1.55t.
How Strong Is SK Square's Balance Sheet?
Zooming in on the latest balance sheet data, we can see that SK Square had liabilities of ₩1.10t due within 12 months and liabilities of ₩756.3b due beyond that. Offsetting this, it had ₩1.60t in cash and ₩666.9b in receivables that were due within 12 months. So it can boast ₩405.3b more liquid assets than total liabilities.
This short term liquidity is a sign that SK Square could probably pay off its debt with ease, as its balance sheet is far from stretched. Simply put, the fact that SK Square has more cash than debt is arguably a good indication that it can manage its debt safely. There's no doubt that we learn most about debt from the balance sheet. But ultimately the future profitability of the business will decide if SK Square can strengthen its balance sheet over time. So if you want to see what the professionals think, you might find this free report on analyst profit forecasts to be interesting.
Over 12 months, SK Square made a loss at the EBIT level, and saw its revenue drop to ₩1.6t, which is a fall of 68%. That makes us nervous, to say the least.
So How Risky Is SK Square?
By their very nature companies that are losing money are more risky than those with a long history of profitability. And the fact is that over the last twelve months SK Square lost money at the earnings before interest and tax (EBIT) line. And over the same period it saw negative free cash outflow of ₩83b and booked a ₩2.6t accounting loss. But the saving grace is the ₩1.55t on the balance sheet. That kitty means the company can keep spending for growth for at least two years, at current rates. Even though its balance sheet seems sufficiently liquid, debt always makes us a little nervous if a company doesn't produce free cash flow regularly. When we look at a riskier company, we like to check how their profits (or losses) are trending over time. Today, we're providing readers this interactive graph showing how SK Square's profit, revenue, and operating cashflow have changed over the last few years.
When all is said and done, sometimes its easier to focus on companies that don't even need debt. Readers can access a list of growth stocks with zero net debt 100% free, right now.
New: Manage All Your Stock Portfolios in One Place
We've created the ultimate portfolio companion for stock investors, and it's free.
• Connect an unlimited number of Portfolios and see your total in one currency
• Be alerted to new Warning Signs or Risks via email or mobile
• Track the Fair Value of your stocks
Have feedback on this article? Concerned about the content? Get in touch with us directly. Alternatively, email editorial-team (at) simplywallst.com.
This article by Simply Wall St is general in nature. We provide commentary based on historical data and analyst forecasts only using an unbiased methodology and our articles are not intended to be financial advice. It does not constitute a recommendation to buy or sell any stock, and does not take account of your objectives, or your financial situation. We aim to bring you long-term focused analysis driven by fundamental data. Note that our analysis may not factor in the latest price-sensitive company announcements or qualitative material. Simply Wall St has no position in any stocks mentioned.
About KOSE:A402340
SK Square
Invests in semiconductor, and information and communication technologies in South Korea, China, Asia, the United States, and Europe.
Undervalued with excellent balance sheet.
Market Insights


Advertisement
Community Narratives
For the Emperor: Why Games Workshop Could Be a Star Investment
Fair Value UK£160.00|0.4% overvalued
RO
Community Contributor
Securitas will boost margins with AI and tech-driven services
Fair Value SEK 260.91|44.5% undervalued
UN
Community Contributor
A Leader in EV Charging with Growth Potential
Fair Value €27.00|17.8% undervalued
TI
Community Contributor