- South Korea
- /
- Electrical
- /
- KOSE:A361610
Would SK IE Technology (KRX:361610) Be Better Off With Less Debt?

Warren Buffett famously said, 'Volatility is far from synonymous with risk.' It's only natural to consider a company's balance sheet when you examine how risky it is, since debt is often involved when a business collapses. We can see that SK IE Technology Co., Ltd. (KRX:361610) does use debt in its business. But the more important question is: how much risk is that debt creating?
Why Does Debt Bring Risk?
Generally speaking, debt only becomes a real problem when a company can't easily pay it off, either by raising capital or with its own cash flow. If things get really bad, the lenders can take control of the business. However, a more usual (but still expensive) situation is where a company must dilute shareholders at a cheap share price simply to get debt under control. Of course, the upside of debt is that it often represents cheap capital, especially when it replaces dilution in a company with the ability to reinvest at high rates of return. When we think about a company's use of debt, we first look at cash and debt together.
See our latest analysis for SK IE Technology
What Is SK IE Technology's Net Debt?
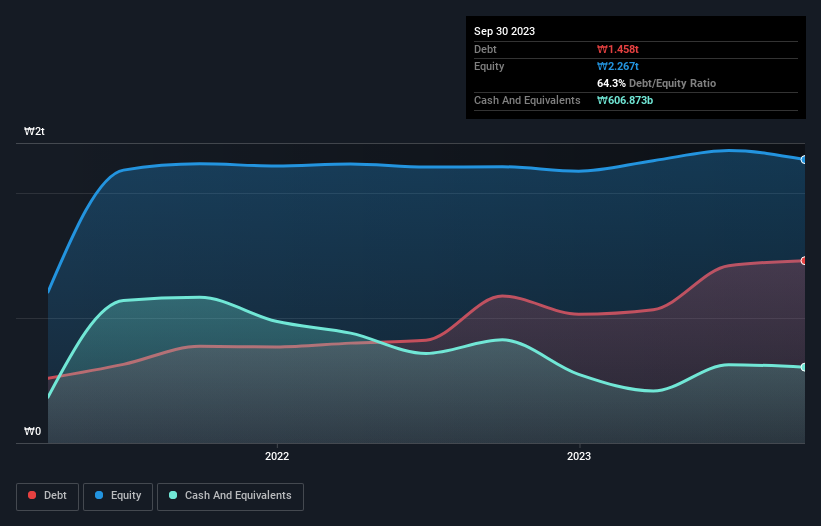
As you can see below, at the end of September 2023, SK IE Technology had ₩1.46t of debt, up from ₩1.18t a year ago. Click the image for more detail. However, because it has a cash reserve of ₩606.9b, its net debt is less, at about ₩851.4b.
How Strong Is SK IE Technology's Balance Sheet?
We can see from the most recent balance sheet that SK IE Technology had liabilities of ₩798.0b falling due within a year, and liabilities of ₩881.9b due beyond that. On the other hand, it had cash of ₩606.9b and ₩145.7b worth of receivables due within a year. So it has liabilities totalling ₩927.3b more than its cash and near-term receivables, combined.
Since publicly traded SK IE Technology shares are worth a total of ₩5.23t, it seems unlikely that this level of liabilities would be a major threat. Having said that, it's clear that we should continue to monitor its balance sheet, lest it change for the worse. When analysing debt levels, the balance sheet is the obvious place to start. But it is future earnings, more than anything, that will determine SK IE Technology's ability to maintain a healthy balance sheet going forward. So if you want to see what the professionals think, you might find this free report on analyst profit forecasts to be interesting.
In the last year SK IE Technology wasn't profitable at an EBIT level, but managed to grow its revenue by 16%, to ₩654b. That rate of growth is a bit slow for our taste, but it takes all types to make a world.
Caveat Emptor
Importantly, SK IE Technology had an earnings before interest and tax (EBIT) loss over the last year. To be specific the EBIT loss came in at ₩5.2b. When we look at that and recall the liabilities on its balance sheet, relative to cash, it seems unwise to us for the company to have any debt. Quite frankly we think the balance sheet is far from match-fit, although it could be improved with time. However, it doesn't help that it burned through ₩544b of cash over the last year. So suffice it to say we consider the stock very risky. When analysing debt levels, the balance sheet is the obvious place to start. However, not all investment risk resides within the balance sheet - far from it. Be aware that SK IE Technology is showing 1 warning sign in our investment analysis , you should know about...
Of course, if you're the type of investor who prefers buying stocks without the burden of debt, then don't hesitate to discover our exclusive list of net cash growth stocks, today.
The New Payments ETF Is Live on NASDAQ:
Money is moving to real-time rails, and a newly listed ETF now gives investors direct exposure. Fast settlement. Institutional custody. Simple access.
Explore how this launch could reshape portfolios
Sponsored ContentNew: Manage All Your Stock Portfolios in One Place
We've created the ultimate portfolio companion for stock investors, and it's free.
• Connect an unlimited number of Portfolios and see your total in one currency
• Be alerted to new Warning Signs or Risks via email or mobile
• Track the Fair Value of your stocks
Have feedback on this article? Concerned about the content? Get in touch with us directly. Alternatively, email editorial-team (at) simplywallst.com.
This article by Simply Wall St is general in nature. We provide commentary based on historical data and analyst forecasts only using an unbiased methodology and our articles are not intended to be financial advice. It does not constitute a recommendation to buy or sell any stock, and does not take account of your objectives, or your financial situation. We aim to bring you long-term focused analysis driven by fundamental data. Note that our analysis may not factor in the latest price-sensitive company announcements or qualitative material. Simply Wall St has no position in any stocks mentioned.
About KOSE:A361610
SK IE Technology
Engages in manufacturing and selling of battery materials in South Korea, Asia, and Europe.
High growth potential and slightly overvalued.
Similar Companies
Market Insights

Weekly Picks

Early mover in a fast growing industry. Likely to experience share price volatility as they scale


A case for CA$31.80 (undiluted), aka 8,616% upside from CA$0.37 (an 86 bagger!).


Moderation and Stabilisation: HOLD: Fair Price based on a 4-year Cycle is $12.08
Recently Updated Narratives


An amazing opportunity to potentially get a 100 bagger

Amazon: Why the World’s Biggest Platform Still Runs on Invisible Economics

Sunrun Stock: When the Energy Transition Collides With the Cost of Capital
Popular Narratives


MicroVision will explode future revenue by 380.37% with a vision towards success


Crazy Undervalued 42 Baggers Silver Play (Active & Running Mine)

