
Advertisement
- South Korea
- /
- Electrical
- /
- KOSE:A011690
Y2 Solution Co., Ltd's (KRX:011690) Stock Has Seen Strong Momentum: Does That Call For Deeper Study Of Its Financial Prospects?

Y2 Solution (KRX:011690) has had a great run on the share market with its stock up by a significant 47% over the last three months. Given that stock prices are usually aligned with a company's financial performance in the long-term, we decided to study its financial indicators more closely to see if they had a hand to play in the recent price move. In this article, we decided to focus on Y2 Solution's ROE.
Return on equity or ROE is a key measure used to assess how efficiently a company's management is utilizing the company's capital. In other words, it is a profitability ratio which measures the rate of return on the capital provided by the company's shareholders.
How Is ROE Calculated?
Return on equity can be calculated by using the formula:
Return on Equity = Net Profit (from continuing operations) ÷ Shareholders' Equity
So, based on the above formula, the ROE for Y2 Solution is:
6.9% = ₩7.5b ÷ ₩109b (Based on the trailing twelve months to September 2024).
The 'return' is the income the business earned over the last year. That means that for every ₩1 worth of shareholders' equity, the company generated ₩0.07 in profit.
See our latest analysis for Y2 Solution
What Is The Relationship Between ROE And Earnings Growth?
Thus far, we have learned that ROE measures how efficiently a company is generating its profits. We now need to evaluate how much profit the company reinvests or "retains" for future growth which then gives us an idea about the growth potential of the company. Assuming everything else remains unchanged, the higher the ROE and profit retention, the higher the growth rate of a company compared to companies that don't necessarily bear these characteristics.
Y2 Solution's Earnings Growth And 6.9% ROE
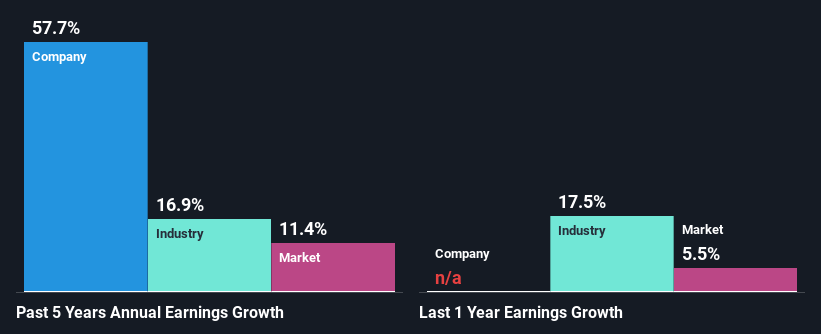
When you first look at it, Y2 Solution's ROE doesn't look that attractive. Next, when compared to the average industry ROE of 8.8%, the company's ROE leaves us feeling even less enthusiastic. In spite of this, Y2 Solution was able to grow its net income considerably, at a rate of 58% in the last five years. Therefore, there could be other reasons behind this growth. Such as - high earnings retention or an efficient management in place.
We then compared Y2 Solution's net income growth with the industry and we're pleased to see that the company's growth figure is higher when compared with the industry which has a growth rate of 17% in the same 5-year period.
Earnings growth is a huge factor in stock valuation. The investor should try to establish if the expected growth or decline in earnings, whichever the case may be, is priced in. Doing so will help them establish if the stock's future looks promising or ominous. One good indicator of expected earnings growth is the P/E ratio which determines the price the market is willing to pay for a stock based on its earnings prospects. So, you may want to check if Y2 Solution is trading on a high P/E or a low P/E, relative to its industry.
Is Y2 Solution Efficiently Re-investing Its Profits?
Given that Y2 Solution doesn't pay any regular dividends to its shareholders, we infer that the company has been reinvesting all of its profits to grow its business.
Conclusion
On the whole, we do feel that Y2 Solution has some positive attributes. With a high rate of reinvestment, albeit at a low ROE, the company has managed to see a considerable growth in its earnings. While we won't completely dismiss the company, what we would do, is try to ascertain how risky the business is to make a more informed decision around the company. Our risks dashboard would have the 3 risks we have identified for Y2 Solution.
New: Manage All Your Stock Portfolios in One Place
We've created the ultimate portfolio companion for stock investors, and it's free.
• Connect an unlimited number of Portfolios and see your total in one currency
• Be alerted to new Warning Signs or Risks via email or mobile
• Track the Fair Value of your stocks
Have feedback on this article? Concerned about the content? Get in touch with us directly. Alternatively, email editorial-team (at) simplywallst.com.
This article by Simply Wall St is general in nature. We provide commentary based on historical data and analyst forecasts only using an unbiased methodology and our articles are not intended to be financial advice. It does not constitute a recommendation to buy or sell any stock, and does not take account of your objectives, or your financial situation. We aim to bring you long-term focused analysis driven by fundamental data. Note that our analysis may not factor in the latest price-sensitive company announcements or qualitative material. Simply Wall St has no position in any stocks mentioned.
About KOSE:A011690
Y2 Solution
Provides TV power supply and LED lighting services in South Korea.
Flawless balance sheet and good value.
Market Insights

Advertisement
Community Narratives

BMW cruising ahead with new EVs and premium models to boost revenue 5%
Fair Value €135.07|43.3% undervalued
UN
Community Contributor
EU#2 - From Humble Beginnings to Global Powerhouse
Fair Value DKK 851.04|50.1% undervalued
TO
Community Contributor