
Advertisement
- South Korea
- /
- Construction
- /
- KOSE:A001470
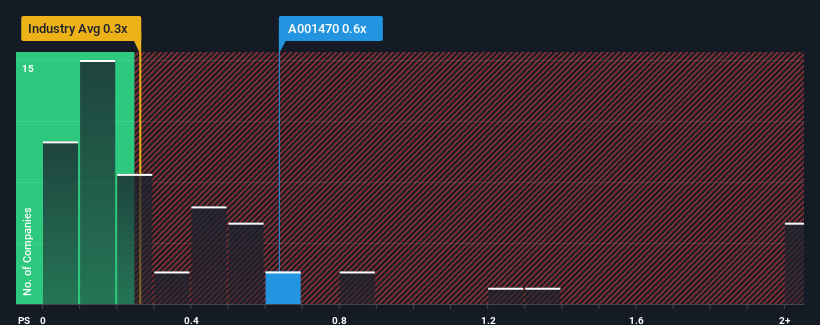
Investors Still Aren't Entirely Convinced By Sambu Engineering & Construction Co., Ltd's (KRX:001470) Revenues Despite 29% Price Jump

Sambu Engineering & Construction Co., Ltd (KRX:001470) shareholders are no doubt pleased to see that the share price has bounced 29% in the last month, although it is still struggling to make up recently lost ground. Not all shareholders will be feeling jubilant, since the share price is still down a very disappointing 16% in the last twelve months.
Although its price has surged higher, you could still be forgiven for feeling indifferent about Sambu Engineering & Construction's P/S ratio of 0.6x, since the median price-to-sales (or "P/S") ratio for the Construction industry in Korea is also close to 0.3x. However, investors might be overlooking a clear opportunity or potential setback if there is no rational basis for the P/S.
View our latest analysis for Sambu Engineering & Construction
How Sambu Engineering & Construction Has Been Performing
With revenue growth that's exceedingly strong of late, Sambu Engineering & Construction has been doing very well. The P/S is probably moderate because investors think this strong revenue growth might not be enough to outperform the broader industry in the near future. Those who are bullish on Sambu Engineering & Construction will be hoping that this isn't the case, so that they can pick up the stock at a lower valuation.
Want the full picture on earnings, revenue and cash flow for the company? Then our free report on Sambu Engineering & Construction will help you shine a light on its historical performance.Is There Some Revenue Growth Forecasted For Sambu Engineering & Construction?
In order to justify its P/S ratio, Sambu Engineering & Construction would need to produce growth that's similar to the industry.
Taking a look back first, we see that the company grew revenue by an impressive 32% last year. The latest three year period has also seen an excellent 52% overall rise in revenue, aided by its short-term performance. Accordingly, shareholders would have definitely welcomed those medium-term rates of revenue growth.
When compared to the industry's one-year growth forecast of 3.7%, the most recent medium-term revenue trajectory is noticeably more alluring
With this information, we find it interesting that Sambu Engineering & Construction is trading at a fairly similar P/S compared to the industry. Apparently some shareholders believe the recent performance is at its limits and have been accepting lower selling prices.
What Does Sambu Engineering & Construction's P/S Mean For Investors?
Its shares have lifted substantially and now Sambu Engineering & Construction's P/S is back within range of the industry median. Typically, we'd caution against reading too much into price-to-sales ratios when settling on investment decisions, though it can reveal plenty about what other market participants think about the company.
We've established that Sambu Engineering & Construction currently trades on a lower than expected P/S since its recent three-year growth is higher than the wider industry forecast. It'd be fair to assume that potential risks the company faces could be the contributing factor to the lower than expected P/S. At least the risk of a price drop looks to be subdued if recent medium-term revenue trends continue, but investors seem to think future revenue could see some volatility.
And what about other risks? Every company has them, and we've spotted 3 warning signs for Sambu Engineering & Construction (of which 2 don't sit too well with us!) you should know about.
Of course, profitable companies with a history of great earnings growth are generally safer bets. So you may wish to see this free collection of other companies that have reasonable P/E ratios and have grown earnings strongly.
New: Manage All Your Stock Portfolios in One Place
We've created the ultimate portfolio companion for stock investors, and it's free.
• Connect an unlimited number of Portfolios and see your total in one currency
• Be alerted to new Warning Signs or Risks via email or mobile
• Track the Fair Value of your stocks
Have feedback on this article? Concerned about the content? Get in touch with us directly. Alternatively, email editorial-team (at) simplywallst.com.
This article by Simply Wall St is general in nature. We provide commentary based on historical data and analyst forecasts only using an unbiased methodology and our articles are not intended to be financial advice. It does not constitute a recommendation to buy or sell any stock, and does not take account of your objectives, or your financial situation. We aim to bring you long-term focused analysis driven by fundamental data. Note that our analysis may not factor in the latest price-sensitive company announcements or qualitative material. Simply Wall St has no position in any stocks mentioned.
About KOSE:A001470
Sambu Engineering & Construction
Engages in the construction business in South Korea and internationally.
Good value slight.
Market Insights


Advertisement
Community Narratives
For the Emperor: Why Games Workshop Could Be a Star Investment
Fair Value UK£160.00|0.4% undervalued
RO
Community Contributor
Securitas will boost margins with AI and tech-driven services
Fair Value SEK 260.91|45.0% undervalued
UN
Community Contributor
A Leader in EV Charging with Growth Potential
Fair Value €27.00|20.4% undervalued
TI
Community Contributor