
Advertisement
- South Korea
- /
- Trade Distributors
- /
- KOSE:A001250
GS Global (KRX:001250) Hasn't Managed To Accelerate Its Returns

To find a multi-bagger stock, what are the underlying trends we should look for in a business? Firstly, we'll want to see a proven return on capital employed (ROCE) that is increasing, and secondly, an expanding base of capital employed. Basically this means that a company has profitable initiatives that it can continue to reinvest in, which is a trait of a compounding machine. However, after investigating GS Global (KRX:001250), we don't think it's current trends fit the mold of a multi-bagger.
Understanding Return On Capital Employed (ROCE)
Just to clarify if you're unsure, ROCE is a metric for evaluating how much pre-tax income (in percentage terms) a company earns on the capital invested in its business. Analysts use this formula to calculate it for GS Global:
Return on Capital Employed = Earnings Before Interest and Tax (EBIT) ÷ (Total Assets - Current Liabilities)
0.12 = ₩74b ÷ (₩1.5t - ₩823b) (Based on the trailing twelve months to June 2024).
Therefore, GS Global has an ROCE of 12%. In absolute terms, that's a satisfactory return, but compared to the Trade Distributors industry average of 7.8% it's much better.
View our latest analysis for GS Global
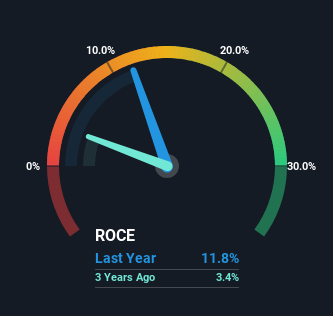
Historical performance is a great place to start when researching a stock so above you can see the gauge for GS Global's ROCE against it's prior returns. If you want to delve into the historical earnings , check out these free graphs detailing revenue and cash flow performance of GS Global.
What Can We Tell From GS Global's ROCE Trend?
There hasn't been much to report for GS Global's returns and its level of capital employed because both metrics have been steady for the past five years. Businesses with these traits tend to be mature and steady operations because they're past the growth phase. With that in mind, unless investment picks up again in the future, we wouldn't expect GS Global to be a multi-bagger going forward.
On a separate but related note, it's important to know that GS Global has a current liabilities to total assets ratio of 57%, which we'd consider pretty high. This effectively means that suppliers (or short-term creditors) are funding a large portion of the business, so just be aware that this can introduce some elements of risk. While it's not necessarily a bad thing, it can be beneficial if this ratio is lower.
What We Can Learn From GS Global's ROCE
In summary, GS Global isn't compounding its earnings but is generating stable returns on the same amount of capital employed. Although the market must be expecting these trends to improve because the stock has gained 69% over the last five years. Ultimately, if the underlying trends persist, we wouldn't hold our breath on it being a multi-bagger going forward.
One more thing, we've spotted 2 warning signs facing GS Global that you might find interesting.
While GS Global may not currently earn the highest returns, we've compiled a list of companies that currently earn more than 25% return on equity. Check out this free list here.
New: Manage All Your Stock Portfolios in One Place
We've created the ultimate portfolio companion for stock investors, and it's free.
• Connect an unlimited number of Portfolios and see your total in one currency
• Be alerted to new Warning Signs or Risks via email or mobile
• Track the Fair Value of your stocks
Have feedback on this article? Concerned about the content? Get in touch with us directly. Alternatively, email editorial-team (at) simplywallst.com.
This article by Simply Wall St is general in nature. We provide commentary based on historical data and analyst forecasts only using an unbiased methodology and our articles are not intended to be financial advice. It does not constitute a recommendation to buy or sell any stock, and does not take account of your objectives, or your financial situation. We aim to bring you long-term focused analysis driven by fundamental data. Note that our analysis may not factor in the latest price-sensitive company announcements or qualitative material. Simply Wall St has no position in any stocks mentioned.
About KOSE:A001250
GS Global
Engages in the import, export, and triangular trade of steel, coal/biomass, petrochemicals, industrial products in South Korea and internationally.
Solid track record with adequate balance sheet.
Market Insights

Advertisement
Community Narratives

BMW cruising ahead with new EVs and premium models to boost revenue 5%
Fair Value €135.07|44.6% undervalued
UN
Community Contributor
EU#2 - From Humble Beginnings to Global Powerhouse
Fair Value DKK 851.04|46.4% undervalued
TO
Community Contributor