- South Korea
- /
- Electrical
- /
- KOSDAQ:A378340
Philenergy (KOSDAQ:378340) Might Be Having Difficulty Using Its Capital Effectively


To find a multi-bagger stock, what are the underlying trends we should look for in a business? One common approach is to try and find a company with returns on capital employed (ROCE) that are increasing, in conjunction with a growing amount of capital employed. Basically this means that a company has profitable initiatives that it can continue to reinvest in, which is a trait of a compounding machine. However, after briefly looking over the numbers, we don't think Philenergy (KOSDAQ:378340) has the makings of a multi-bagger going forward, but let's have a look at why that may be.
Return On Capital Employed (ROCE): What Is It?
For those that aren't sure what ROCE is, it measures the amount of pre-tax profits a company can generate from the capital employed in its business. Analysts use this formula to calculate it for Philenergy:
Return on Capital Employed = Earnings Before Interest and Tax (EBIT) ÷ (Total Assets - Current Liabilities)
0.11 = ₩17b ÷ (₩216b - ₩69b) (Based on the trailing twelve months to September 2024).
Thus, Philenergy has an ROCE of 11%. On its own, that's a standard return, however it's much better than the 7.7% generated by the Electrical industry.
See our latest analysis for Philenergy
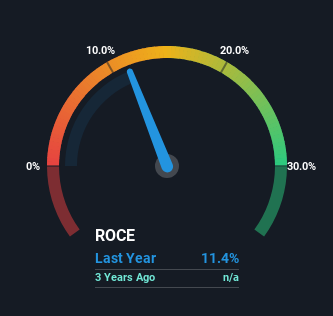
Historical performance is a great place to start when researching a stock so above you can see the gauge for Philenergy's ROCE against it's prior returns. If you're interested in investigating Philenergy's past further, check out this free graph covering Philenergy's past earnings, revenue and cash flow.
How Are Returns Trending?
In terms of Philenergy's historical ROCE movements, the trend isn't fantastic. To be more specific, ROCE has fallen from 26% over the last two years. Although, given both revenue and the amount of assets employed in the business have increased, it could suggest the company is investing in growth, and the extra capital has led to a short-term reduction in ROCE. And if the increased capital generates additional returns, the business, and thus shareholders, will benefit in the long run.
On a side note, Philenergy has done well to pay down its current liabilities to 32% of total assets. So we could link some of this to the decrease in ROCE. What's more, this can reduce some aspects of risk to the business because now the company's suppliers or short-term creditors are funding less of its operations. Since the business is basically funding more of its operations with it's own money, you could argue this has made the business less efficient at generating ROCE.
What We Can Learn From Philenergy's ROCE
While returns have fallen for Philenergy in recent times, we're encouraged to see that sales are growing and that the business is reinvesting in its operations. And there could be an opportunity here if other metrics look good too, because the stock has declined 36% in the last year. As a result, we'd recommend researching this stock further to uncover what other fundamentals of the business can show us.
One final note, you should learn about the 2 warning signs we've spotted with Philenergy (including 1 which doesn't sit too well with us) .
While Philenergy may not currently earn the highest returns, we've compiled a list of companies that currently earn more than 25% return on equity. Check out this free list here.
If you're looking to trade Philenergy, open an account with the lowest-cost platform trusted by professionals, Interactive Brokers.
With clients in over 200 countries and territories, and access to 160 markets, IBKR lets you trade stocks, options, futures, forex, bonds and funds from a single integrated account.
Enjoy no hidden fees, no account minimums, and FX conversion rates as low as 0.03%, far better than what most brokers offer.
Sponsored ContentNew: Manage All Your Stock Portfolios in One Place
We've created the ultimate portfolio companion for stock investors, and it's free.
• Connect an unlimited number of Portfolios and see your total in one currency
• Be alerted to new Warning Signs or Risks via email or mobile
• Track the Fair Value of your stocks
Have feedback on this article? Concerned about the content? Get in touch with us directly. Alternatively, email editorial-team (at) simplywallst.com.
This article by Simply Wall St is general in nature. We provide commentary based on historical data and analyst forecasts only using an unbiased methodology and our articles are not intended to be financial advice. It does not constitute a recommendation to buy or sell any stock, and does not take account of your objectives, or your financial situation. We aim to bring you long-term focused analysis driven by fundamental data. Note that our analysis may not factor in the latest price-sensitive company announcements or qualitative material. Simply Wall St has no position in any stocks mentioned.
About KOSDAQ:A378340
Philenergy
Supplies notching equipment and in EV battery equipment in South Korea.
Adequate balance sheet very low.
Market Insights

Community Narratives

