
Advertisement
- South Korea
- /
- Electrical
- /
- KOSDAQ:A340930
Is Youil Energy TechLtd (KOSDAQ:340930) Using Debt In A Risky Way?
The external fund manager backed by Berkshire Hathaway's Charlie Munger, Li Lu, makes no bones about it when he says 'The biggest investment risk is not the volatility of prices, but whether you will suffer a permanent loss of capital.' So it might be obvious that you need to consider debt, when you think about how risky any given stock is, because too much debt can sink a company. We can see that Youil Energy Tech Co.,Ltd. (KOSDAQ:340930) does use debt in its business. But the real question is whether this debt is making the company risky.
When Is Debt A Problem?
Debt assists a business until the business has trouble paying it off, either with new capital or with free cash flow. Part and parcel of capitalism is the process of 'creative destruction' where failed businesses are mercilessly liquidated by their bankers. However, a more common (but still painful) scenario is that it has to raise new equity capital at a low price, thus permanently diluting shareholders. Of course, plenty of companies use debt to fund growth, without any negative consequences. When we examine debt levels, we first consider both cash and debt levels, together.
See our latest analysis for Youil Energy TechLtd
What Is Youil Energy TechLtd's Net Debt?
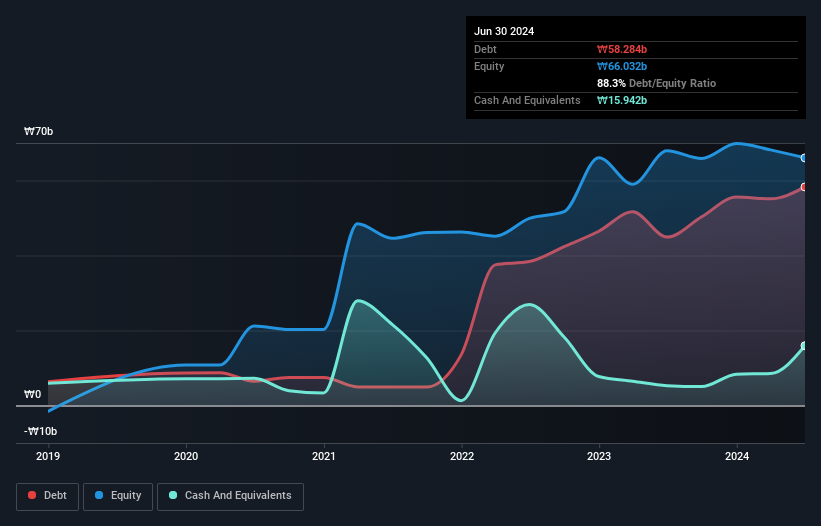
As you can see below, at the end of June 2024, Youil Energy TechLtd had ₩58.3b of debt, up from ₩44.9b a year ago. Click the image for more detail. However, it does have ₩15.9b in cash offsetting this, leading to net debt of about ₩42.3b.
How Strong Is Youil Energy TechLtd's Balance Sheet?
The latest balance sheet data shows that Youil Energy TechLtd had liabilities of ₩103.7b due within a year, and liabilities of ₩23.6b falling due after that. Offsetting these obligations, it had cash of ₩15.9b as well as receivables valued at ₩10.6b due within 12 months. So it has liabilities totalling ₩100.8b more than its cash and near-term receivables, combined.
Given this deficit is actually higher than the company's market capitalization of ₩95.4b, we think shareholders really should watch Youil Energy TechLtd's debt levels, like a parent watching their child ride a bike for the first time. In the scenario where the company had to clean up its balance sheet quickly, it seems likely shareholders would suffer extensive dilution. There's no doubt that we learn most about debt from the balance sheet. But it is Youil Energy TechLtd's earnings that will influence how the balance sheet holds up in the future. So if you're keen to discover more about its earnings, it might be worth checking out this graph of its long term earnings trend.
Over 12 months, Youil Energy TechLtd reported revenue of ₩52b, which is a gain of 10%, although it did not report any earnings before interest and tax. We usually like to see faster growth from unprofitable companies, but each to their own.
Caveat Emptor
Importantly, Youil Energy TechLtd had an earnings before interest and tax (EBIT) loss over the last year. Indeed, it lost a very considerable ₩11b at the EBIT level. When we look at that alongside the significant liabilities, we're not particularly confident about the company. It would need to improve its operations quickly for us to be interested in it. Not least because it burned through ₩7.1b in negative free cash flow over the last year. That means it's on the risky side of things. The balance sheet is clearly the area to focus on when you are analysing debt. But ultimately, every company can contain risks that exist outside of the balance sheet. These risks can be hard to spot. Every company has them, and we've spotted 4 warning signs for Youil Energy TechLtd (of which 3 are significant!) you should know about.
When all is said and done, sometimes its easier to focus on companies that don't even need debt. Readers can access a list of growth stocks with zero net debt 100% free, right now.
New: Manage All Your Stock Portfolios in One Place
We've created the ultimate portfolio companion for stock investors, and it's free.
• Connect an unlimited number of Portfolios and see your total in one currency
• Be alerted to new Warning Signs or Risks via email or mobile
• Track the Fair Value of your stocks
Have feedback on this article? Concerned about the content? Get in touch with us directly. Alternatively, email editorial-team (at) simplywallst.com.
This article by Simply Wall St is general in nature. We provide commentary based on historical data and analyst forecasts only using an unbiased methodology and our articles are not intended to be financial advice. It does not constitute a recommendation to buy or sell any stock, and does not take account of your objectives, or your financial situation. We aim to bring you long-term focused analysis driven by fundamental data. Note that our analysis may not factor in the latest price-sensitive company announcements or qualitative material. Simply Wall St has no position in any stocks mentioned.
About KOSDAQ:A340930
Youil Energy TechLtd
Youil Energy Technology Co.,Ltd manufactures secondary batteries and fuel cells in South Korea.
Mediocre balance sheet with low risk.
Market Insights

Advertisement
Weekly Picks
RO


RockeTeller on Santacruz Silver Mining ·
Crazy Undervalued 42 Baggers Silver Play (Active & Running Mine)
Fair Value:CA$8696.7% undervalued
67 followersusers have followed this narrative
7 commentsusers have commented on this narrative
20 likesusers have liked this narrative
RO


Robbo on Fiducian Group ·
Fiducian: Compliance Clouds or Value Opportunity?
Fair Value:AU$123.9% undervalued
11 followersusers have followed this narrative
0 commentsusers have commented on this narrative
0 likesusers have liked this narrative
WO

woodworthfund on Willamette Valley Vineyards ·
Willamette Valley Vineyards (WVVI): Not-So-Great Value
Fair Value:US$242.5% overvalued
11 followersusers have followed this narrative
0 commentsusers have commented on this narrative
1 likeusers have liked this narrative
Recently Updated Narratives
EN

Enemy on Halyk Bank of Kazakhstan ·
Halyk Bank of Kazakhstan will see revenue grow 11% as their future PE reaches 3.2x soon
Fair Value:US$52.2351.3% undervalued
1 followerusers have followed this narrative
0 commentsusers have commented on this narrative
0 likesusers have liked this narrative
IN

IncomeAssets on Magma Silver ·
Silver's Breakout to over $50US will make Magma’s future shine with drill sampling returning 115g/t Silver and 2.3 g/t Gold at its Peru Mine
Fair Value:CA$0.3534.3% undervalued
4 followersusers have followed this narrative
0 commentsusers have commented on this narrative
0 likesusers have liked this narrative
CO

composite32 on SEGRO ·
SEGRO's Revenue to Rise 14.7% Amidst Optimistic Growth Plans
Fair Value:UK£9.3925.9% undervalued
1 followerusers have followed this narrative
0 commentsusers have commented on this narrative
0 likesusers have liked this narrative
Popular Narratives
TH


TheWallstreetKing on MicroVision ·
MicroVision will explode future revenue by 380.37% with a vision towards success
Fair Value:US$6098.5% undervalued
118 followersusers have followed this narrative
11 commentsusers have commented on this narrative
22 likesusers have liked this narrative
AN


AnalystConsensusTarget on NVIDIA ·
NVDA: Expanding AI Demand Will Drive Major Data Center Investments Through 2026
Fair Value:US$250.3927.2% undervalued
959 followersusers have followed this narrative
6 commentsusers have commented on this narrative
25 likesusers have liked this narrative
RO
RockeTeller on Santacruz Silver Mining ·
Crazy Undervalued 42 Baggers Silver Play (Active & Running Mine)
Fair Value:CA$8696.7% undervalued
67 followersusers have followed this narrative
7 commentsusers have commented on this narrative
20 likesusers have liked this narrative
