

David Iben put it well when he said, 'Volatility is not a risk we care about. What we care about is avoiding the permanent loss of capital.' It's only natural to consider a company's balance sheet when you examine how risky it is, since debt is often involved when a business collapses. Importantly, Hytc Co., Ltd (KOSDAQ:148930) does carry debt. But the more important question is: how much risk is that debt creating?
Why Does Debt Bring Risk?
Generally speaking, debt only becomes a real problem when a company can't easily pay it off, either by raising capital or with its own cash flow. Part and parcel of capitalism is the process of 'creative destruction' where failed businesses are mercilessly liquidated by their bankers. While that is not too common, we often do see indebted companies permanently diluting shareholders because lenders force them to raise capital at a distressed price. Having said that, the most common situation is where a company manages its debt reasonably well - and to its own advantage. The first step when considering a company's debt levels is to consider its cash and debt together.
Check out our latest analysis for Hytc
What Is Hytc's Debt?
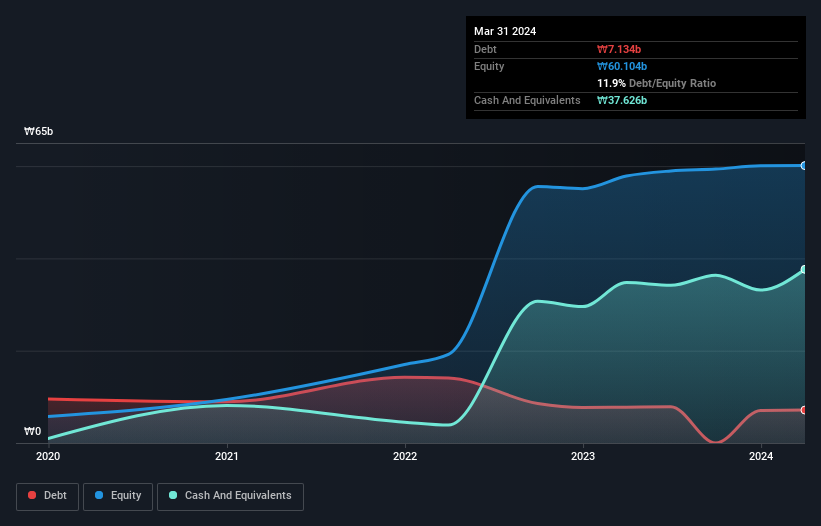
The image below, which you can click on for greater detail, shows that Hytc had debt of ₩7.13b at the end of March 2024, a reduction from ₩7.77b over a year. But on the other hand it also has ₩37.6b in cash, leading to a ₩30.5b net cash position.
How Healthy Is Hytc's Balance Sheet?
Zooming in on the latest balance sheet data, we can see that Hytc had liabilities of ₩4.82b due within 12 months and liabilities of ₩6.62b due beyond that. On the other hand, it had cash of ₩37.6b and ₩9.14b worth of receivables due within a year. So it can boast ₩35.3b more liquid assets than total liabilities.
This luscious liquidity implies that Hytc's balance sheet is sturdy like a giant sequoia tree. On this view, lenders should feel as safe as the beloved of a black-belt karate master. Simply put, the fact that Hytc has more cash than debt is arguably a good indication that it can manage its debt safely.
But the other side of the story is that Hytc saw its EBIT decline by 8.1% over the last year. If earnings continue to decline at that rate the company may have increasing difficulty managing its debt load. When analysing debt levels, the balance sheet is the obvious place to start. But it is Hytc's earnings that will influence how the balance sheet holds up in the future. So when considering debt, it's definitely worth looking at the earnings trend. Click here for an interactive snapshot.
Finally, a company can only pay off debt with cold hard cash, not accounting profits. While Hytc has net cash on its balance sheet, it's still worth taking a look at its ability to convert earnings before interest and tax (EBIT) to free cash flow, to help us understand how quickly it is building (or eroding) that cash balance. In the last three years, Hytc's free cash flow amounted to 39% of its EBIT, less than we'd expect. That's not great, when it comes to paying down debt.
Summing Up
While it is always sensible to investigate a company's debt, in this case Hytc has ₩30.5b in net cash and a decent-looking balance sheet. So we don't think Hytc's use of debt is risky. There's no doubt that we learn most about debt from the balance sheet. But ultimately, every company can contain risks that exist outside of the balance sheet. Case in point: We've spotted 1 warning sign for Hytc you should be aware of.
When all is said and done, sometimes its easier to focus on companies that don't even need debt. Readers can access a list of growth stocks with zero net debt 100% free, right now.
If you're looking to trade Hytc, open an account with the lowest-cost platform trusted by professionals, Interactive Brokers.
With clients in over 200 countries and territories, and access to 160 markets, IBKR lets you trade stocks, options, futures, forex, bonds and funds from a single integrated account.
Enjoy no hidden fees, no account minimums, and FX conversion rates as low as 0.03%, far better than what most brokers offer.
Sponsored ContentValuation is complex, but we're here to simplify it.
Discover if Hytc might be undervalued or overvalued with our detailed analysis, featuring fair value estimates, potential risks, dividends, insider trades, and its financial condition.
Access Free AnalysisHave feedback on this article? Concerned about the content? Get in touch with us directly. Alternatively, email editorial-team (at) simplywallst.com.
This article by Simply Wall St is general in nature. We provide commentary based on historical data and analyst forecasts only using an unbiased methodology and our articles are not intended to be financial advice. It does not constitute a recommendation to buy or sell any stock, and does not take account of your objectives, or your financial situation. We aim to bring you long-term focused analysis driven by fundamental data. Note that our analysis may not factor in the latest price-sensitive company announcements or qualitative material. Simply Wall St has no position in any stocks mentioned.
About KOSDAQ:A148930
Hytc
Manufactures and sells high-precision parts in Korea and internationally.
Flawless balance sheet and good value.
Market Insights

Community Narratives

