
Advertisement
- South Korea
- /
- Electrical
- /
- KOSDAQ:A119850
Will Weakness in GnCenergy Co., Ltd's (KOSDAQ:119850) Stock Prove Temporary Given Strong Fundamentals?
It is hard to get excited after looking at GnCenergy's (KOSDAQ:119850) recent performance, when its stock has declined 14% over the past week. But if you pay close attention, you might gather that its strong financials could mean that the stock could potentially see an increase in value in the long-term, given how markets usually reward companies with good financial health. Specifically, we decided to study GnCenergy's ROE in this article.
Return on Equity or ROE is a test of how effectively a company is growing its value and managing investors’ money. Simply put, it is used to assess the profitability of a company in relation to its equity capital.
How Is ROE Calculated?
ROE can be calculated by using the formula:
Return on Equity = Net Profit (from continuing operations) ÷ Shareholders' Equity
So, based on the above formula, the ROE for GnCenergy is:
22% = ₩41b ÷ ₩184b (Based on the trailing twelve months to June 2025).
The 'return' refers to a company's earnings over the last year. So, this means that for every ₩1 of its shareholder's investments, the company generates a profit of ₩0.22.
Check out our latest analysis for GnCenergy
What Has ROE Got To Do With Earnings Growth?
So far, we've learned that ROE is a measure of a company's profitability. We now need to evaluate how much profit the company reinvests or "retains" for future growth which then gives us an idea about the growth potential of the company. Assuming all else is equal, companies that have both a higher return on equity and higher profit retention are usually the ones that have a higher growth rate when compared to companies that don't have the same features.
GnCenergy's Earnings Growth And 22% ROE
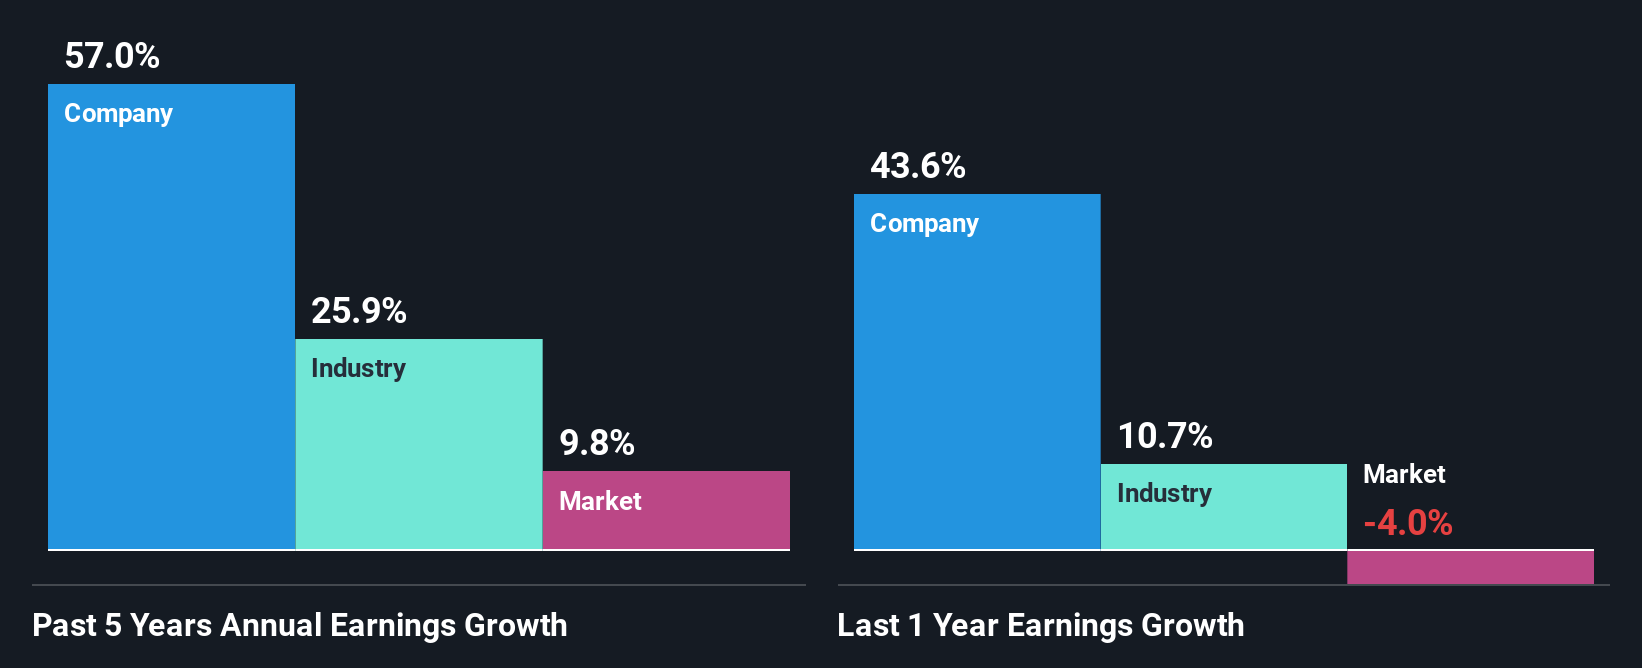
To start with, GnCenergy's ROE looks acceptable. On comparing with the average industry ROE of 9.1% the company's ROE looks pretty remarkable. This probably laid the ground for GnCenergy's significant 57% net income growth seen over the past five years. We reckon that there could also be other factors at play here. Such as - high earnings retention or an efficient management in place.
We then compared GnCenergy's net income growth with the industry and we're pleased to see that the company's growth figure is higher when compared with the industry which has a growth rate of 26% in the same 5-year period.
Earnings growth is a huge factor in stock valuation. What investors need to determine next is if the expected earnings growth, or the lack of it, is already built into the share price. This then helps them determine if the stock is placed for a bright or bleak future. Has the market priced in the future outlook for A119850? You can find out in our latest intrinsic value infographic research report
Is GnCenergy Efficiently Re-investing Its Profits?
GnCenergy's ' three-year median payout ratio is on the lower side at 9.2% implying that it is retaining a higher percentage (91%) of its profits. So it seems like the management is reinvesting profits heavily to grow its business and this reflects in its earnings growth number.
Moreover, GnCenergy is determined to keep sharing its profits with shareholders which we infer from its long history of six years of paying a dividend.
Conclusion
Overall, we are quite pleased with GnCenergy's performance. Particularly, we like that the company is reinvesting heavily into its business, and at a high rate of return. Unsurprisingly, this has led to an impressive earnings growth. If the company continues to grow its earnings the way it has, that could have a positive impact on its share price given how earnings per share influence long-term share prices. Not to forget, share price outcomes are also dependent on the potential risks a company may face. So it is important for investors to be aware of the risks involved in the business. To know the 1 risk we have identified for GnCenergy visit our risks dashboard for free.
New: Manage All Your Stock Portfolios in One Place
We've created the ultimate portfolio companion for stock investors, and it's free.
• Connect an unlimited number of Portfolios and see your total in one currency
• Be alerted to new Warning Signs or Risks via email or mobile
• Track the Fair Value of your stocks
Have feedback on this article? Concerned about the content? Get in touch with us directly. Alternatively, email editorial-team (at) simplywallst.com.
This article by Simply Wall St is general in nature. We provide commentary based on historical data and analyst forecasts only using an unbiased methodology and our articles are not intended to be financial advice. It does not constitute a recommendation to buy or sell any stock, and does not take account of your objectives, or your financial situation. We aim to bring you long-term focused analysis driven by fundamental data. Note that our analysis may not factor in the latest price-sensitive company announcements or qualitative material. Simply Wall St has no position in any stocks mentioned.
About KOSDAQ:A119850
GnCenergy
Engages in the manufacture and sale of power generators in Korea.
Flawless balance sheet with proven track record.
Market Insights

Advertisement
Community Narratives
Quality at a Premium. A time to watch, not to buy?
Fair Value US$154.56|26.1% undervalued
DA
Community Contributor
GRAB: The Super-App at the Heart of Southeast Asia’s Digital Boom
Fair Value US$8.20|21.3% undervalued
BL
Community Contributor
Verve Group to Surge with 51.61% Revenue Growth
Fair Value €6.00|61.2% undervalued
ME
Community Contributor