
Advertisement
- South Korea
- /
- Electrical
- /
- KOSDAQ:A119850
How Good Is GnCenergy Co., Ltd (KOSDAQ:119850) At Creating Shareholder Value?

Today we'll look at GnCenergy Co., Ltd (KOSDAQ:119850) and reflect on its potential as an investment. Specifically, we're going to calculate its Return On Capital Employed (ROCE), in the hopes of getting some insight into the business.
Firstly, we'll go over how we calculate ROCE. Next, we'll compare it to others in its industry. Finally, we'll look at how its current liabilities affect its ROCE.
What is Return On Capital Employed (ROCE)?
ROCE measures the 'return' (pre-tax profit) a company generates from capital employed in its business. In general, businesses with a higher ROCE are usually better quality. In brief, it is a useful tool, but it is not without drawbacks. Renowned investment researcher Michael Mauboussin has suggested that a high ROCE can indicate that 'one dollar invested in the company generates value of more than one dollar'.
So, How Do We Calculate ROCE?
The formula for calculating the return on capital employed is:
Return on Capital Employed = Earnings Before Interest and Tax (EBIT) ÷ (Total Assets - Current Liabilities)
Or for GnCenergy:
0.091 = ₩8.9b ÷ (₩151b - ₩53b) (Based on the trailing twelve months to March 2020.)
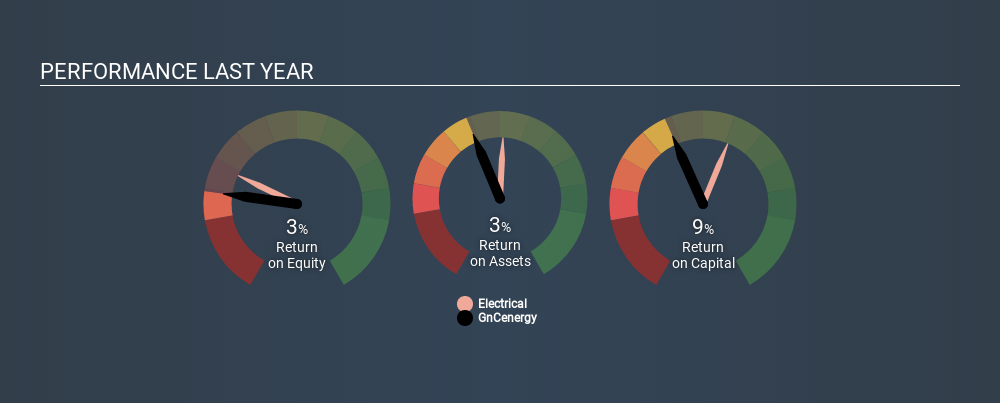
So, GnCenergy has an ROCE of 9.1%.
See our latest analysis for GnCenergy
Is GnCenergy's ROCE Good?
ROCE can be useful when making comparisons, such as between similar companies. It appears that GnCenergy's ROCE is fairly close to the Electrical industry average of 8.0%. Aside from the industry comparison, GnCenergy's ROCE is mediocre in absolute terms, considering the risk of investing in stocks versus the safety of a bank account. Readers may find more attractive investment prospects elsewhere.
GnCenergy's current ROCE of 9.1% is lower than its ROCE in the past, which was 15%, 3 years ago. Therefore we wonder if the company is facing new headwinds. You can click on the image below to see (in greater detail) how GnCenergy's past growth compares to other companies.
Remember that this metric is backwards looking - it shows what has happened in the past, and does not accurately predict the future. ROCE can be deceptive for cyclical businesses, as returns can look incredible in boom times, and terribly low in downturns. ROCE is, after all, simply a snap shot of a single year. Since the future is so important for investors, you should check out our free report on analyst forecasts for GnCenergy.
Do GnCenergy's Current Liabilities Skew Its ROCE?
Liabilities, such as supplier bills and bank overdrafts, are referred to as current liabilities if they need to be paid within 12 months. Due to the way ROCE is calculated, a high level of current liabilities makes a company look as though it has less capital employed, and thus can (sometimes unfairly) boost the ROCE. To check the impact of this, we calculate if a company has high current liabilities relative to its total assets.
GnCenergy has current liabilities of ₩53b and total assets of ₩151b. As a result, its current liabilities are equal to approximately 35% of its total assets. GnCenergy has a medium level of current liabilities, which would boost its ROCE somewhat.
What We Can Learn From GnCenergy's ROCE
Unfortunately, its ROCE is still uninspiring, and there are potentially more attractive prospects out there. You might be able to find a better investment than GnCenergy. If you want a selection of possible winners, check out this free list of interesting companies that trade on a P/E below 20 (but have proven they can grow earnings).
For those who like to find winning investments this free list of growing companies with recent insider purchasing, could be just the ticket.
Love or hate this article? Concerned about the content? Get in touch with us directly. Alternatively, email editorial-team@simplywallst.com.
This article by Simply Wall St is general in nature. It does not constitute a recommendation to buy or sell any stock, and does not take account of your objectives, or your financial situation. We aim to bring you long-term focused analysis driven by fundamental data. Note that our analysis may not factor in the latest price-sensitive company announcements or qualitative material. Simply Wall St has no position in any stocks mentioned. Thank you for reading.
About KOSDAQ:A119850
GnCenergy
Engages in the manufacture and sale of power generators in Korea.
Outstanding track record with flawless balance sheet.
Market Insights

Advertisement
Community Narratives
MicroStrategy: Volatile Gamble or Golden Opportunity?
Fair Value US$663.00|36.2% undervalued
BL
Community Contributor
Emerging Markets and Debt Reduction Will Propel Bath & Body Works Forward
Fair Value US$40.73|22.0% undervalued
ZW
Community Contributor
An amazing opportunity to potentially get a 100 bagger
Fair Value US$10.00|46.4% overvalued
DA
Community Contributor