
Advertisement
Some say volatility, rather than debt, is the best way to think about risk as an investor, but Warren Buffett famously said that 'Volatility is far from synonymous with risk.' So it seems the smart money knows that debt - which is usually involved in bankruptcies - is a very important factor, when you assess how risky a company is. We note that KSP Co., Ltd. (KOSDAQ:073010) does have debt on its balance sheet. But should shareholders be worried about its use of debt?
When Is Debt A Problem?
Debt is a tool to help businesses grow, but if a business is incapable of paying off its lenders, then it exists at their mercy. Ultimately, if the company can't fulfill its legal obligations to repay debt, shareholders could walk away with nothing. However, a more usual (but still expensive) situation is where a company must dilute shareholders at a cheap share price simply to get debt under control. Of course, debt can be an important tool in businesses, particularly capital heavy businesses. When we examine debt levels, we first consider both cash and debt levels, together.
View our latest analysis for KSP
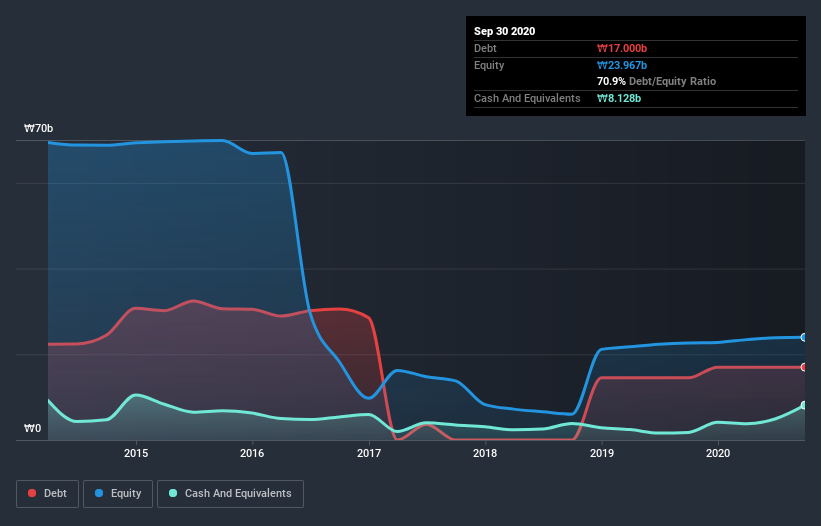
How Much Debt Does KSP Carry?
You can click the graphic below for the historical numbers, but it shows that as of September 2020 KSP had ₩17.0b of debt, an increase on ₩14.5b, over one year. However, because it has a cash reserve of ₩8.13b, its net debt is less, at about ₩8.87b.
How Strong Is KSP's Balance Sheet?
According to the last reported balance sheet, KSP had liabilities of ₩18.2b due within 12 months, and liabilities of ₩3.98b due beyond 12 months. Offsetting this, it had ₩8.13b in cash and ₩4.23b in receivables that were due within 12 months. So its liabilities outweigh the sum of its cash and (near-term) receivables by ₩9.85b.
Given KSP has a market capitalization of ₩56.3b, it's hard to believe these liabilities pose much threat. But there are sufficient liabilities that we would certainly recommend shareholders continue to monitor the balance sheet, going forward.
We use two main ratios to inform us about debt levels relative to earnings. The first is net debt divided by earnings before interest, tax, depreciation, and amortization (EBITDA), while the second is how many times its earnings before interest and tax (EBIT) covers its interest expense (or its interest cover, for short). The advantage of this approach is that we take into account both the absolute quantum of debt (with net debt to EBITDA) and the actual interest expenses associated with that debt (with its interest cover ratio).
KSP has a debt to EBITDA ratio of 3.4 and its EBIT covered its interest expense 3.6 times. Taken together this implies that, while we wouldn't want to see debt levels rise, we think it can handle its current leverage. The silver lining is that KSP grew its EBIT by 2,592% last year, which nourishing like the idealism of youth. If that earnings trend continues it will make its debt load much more manageable in the future. The balance sheet is clearly the area to focus on when you are analysing debt. But you can't view debt in total isolation; since KSP will need earnings to service that debt. So if you're keen to discover more about its earnings, it might be worth checking out this graph of its long term earnings trend.
Finally, a company can only pay off debt with cold hard cash, not accounting profits. So we clearly need to look at whether that EBIT is leading to corresponding free cash flow. Happily for any shareholders, KSP actually produced more free cash flow than EBIT over the last two years. That sort of strong cash generation warms our hearts like a puppy in a bumblebee suit.
Our View
KSP's conversion of EBIT to free cash flow suggests it can handle its debt as easily as Cristiano Ronaldo could score a goal against an under 14's goalkeeper. But, on a more sombre note, we are a little concerned by its interest cover. When we consider the range of factors above, it looks like KSP is pretty sensible with its use of debt. That means they are taking on a bit more risk, in the hope of boosting shareholder returns. When analysing debt levels, the balance sheet is the obvious place to start. But ultimately, every company can contain risks that exist outside of the balance sheet. For example, we've discovered 2 warning signs for KSP that you should be aware of before investing here.
Of course, if you're the type of investor who prefers buying stocks without the burden of debt, then don't hesitate to discover our exclusive list of net cash growth stocks, today.
When trading KSP or any other investment, use the platform considered by many to be the Professional's Gateway to the Worlds Market, Interactive Brokers. You get the lowest-cost* trading on stocks, options, futures, forex, bonds and funds worldwide from a single integrated account. Promoted
Valuation is complex, but we're here to simplify it.
Discover if KSP might be undervalued or overvalued with our detailed analysis, featuring fair value estimates, potential risks, dividends, insider trades, and its financial condition.
Access Free AnalysisThis article by Simply Wall St is general in nature. It does not constitute a recommendation to buy or sell any stock, and does not take account of your objectives, or your financial situation. We aim to bring you long-term focused analysis driven by fundamental data. Note that our analysis may not factor in the latest price-sensitive company announcements or qualitative material. Simply Wall St has no position in any stocks mentioned.
*Interactive Brokers Rated Lowest Cost Broker by StockBrokers.com Annual Online Review 2020
Have feedback on this article? Concerned about the content? Get in touch with us directly. Alternatively, email editorial-team (at) simplywallst.com.
About KOSDAQ:A073010
Very low risk with weak fundamentals.
Market Insights

Advertisement
Community Narratives
Kodiak AI - a potential 100 bagger opportunity?
Fair Value US$14.00|41.9% undervalued
DA
Community Contributor
A Fair Price for a Great Business Facing Real Threats
Fair Value US$383.06|14.1% undervalued
IM
Community Contributor
AXON And Shopify Integration Will Unlock Global Mobile Advertising
Fair Value US$613.59|1.3% undervalued
AN
Based on Analyst Price Targets