
Advertisement
- South Korea
- /
- Machinery
- /
- KOSDAQ:A073010
Could The Market Be Wrong About KSP Co., Ltd. (KOSDAQ:073010) Given Its Attractive Financial Prospects?

With its stock down 13% over the past three months, it is easy to disregard KSP (KOSDAQ:073010). However, a closer look at its sound financials might cause you to think again. Given that fundamentals usually drive long-term market outcomes, the company is worth looking at. Specifically, we decided to study KSP's ROE in this article.
Return on equity or ROE is a key measure used to assess how efficiently a company's management is utilizing the company's capital. Put another way, it reveals the company's success at turning shareholder investments into profits.
Our free stock report includes 1 warning sign investors should be aware of before investing in KSP. Read for free now.How Is ROE Calculated?
Return on equity can be calculated by using the formula:
Return on Equity = Net Profit (from continuing operations) ÷ Shareholders' Equity
So, based on the above formula, the ROE for KSP is:
21% = ₩15b ÷ ₩71b (Based on the trailing twelve months to December 2024).
The 'return' is the income the business earned over the last year. So, this means that for every ₩1 of its shareholder's investments, the company generates a profit of ₩0.21.
View our latest analysis for KSP
What Is The Relationship Between ROE And Earnings Growth?
We have already established that ROE serves as an efficient profit-generating gauge for a company's future earnings. We now need to evaluate how much profit the company reinvests or "retains" for future growth which then gives us an idea about the growth potential of the company. Generally speaking, other things being equal, firms with a high return on equity and profit retention, have a higher growth rate than firms that don’t share these attributes.
A Side By Side comparison of KSP's Earnings Growth And 21% ROE
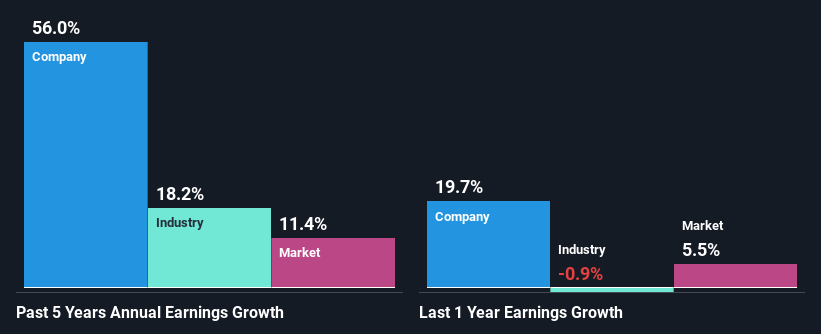
At first glance, KSP seems to have a decent ROE. On comparing with the average industry ROE of 7.2% the company's ROE looks pretty remarkable. Probably as a result of this, KSP was able to see an impressive net income growth of 56% over the last five years. However, there could also be other causes behind this growth. For instance, the company has a low payout ratio or is being managed efficiently.
As a next step, we compared KSP's net income growth with the industry, and pleasingly, we found that the growth seen by the company is higher than the average industry growth of 18%.
The basis for attaching value to a company is, to a great extent, tied to its earnings growth. It’s important for an investor to know whether the market has priced in the company's expected earnings growth (or decline). By doing so, they will have an idea if the stock is headed into clear blue waters or if swampy waters await. If you're wondering about KSP's's valuation, check out this gauge of its price-to-earnings ratio, as compared to its industry.
Is KSP Efficiently Re-investing Its Profits?
Summary
On the whole, we feel that KSP's performance has been quite good. In particular, it's great to see that the company is investing heavily into its business and along with a high rate of return, that has resulted in a sizeable growth in its earnings. If the company continues to grow its earnings the way it has, that could have a positive impact on its share price given how earnings per share influence long-term share prices. Let's not forget, business risk is also one of the factors that affects the price of the stock. So this is also an important area that investors need to pay attention to before making a decision on any business. You can see the 1 risk we have identified for KSP by visiting our risks dashboard for free on our platform here.
Valuation is complex, but we're here to simplify it.
Discover if KSP might be undervalued or overvalued with our detailed analysis, featuring fair value estimates, potential risks, dividends, insider trades, and its financial condition.
Access Free AnalysisHave feedback on this article? Concerned about the content? Get in touch with us directly. Alternatively, email editorial-team (at) simplywallst.com.
This article by Simply Wall St is general in nature. We provide commentary based on historical data and analyst forecasts only using an unbiased methodology and our articles are not intended to be financial advice. It does not constitute a recommendation to buy or sell any stock, and does not take account of your objectives, or your financial situation. We aim to bring you long-term focused analysis driven by fundamental data. Note that our analysis may not factor in the latest price-sensitive company announcements or qualitative material. Simply Wall St has no position in any stocks mentioned.
About KOSDAQ:A073010
Flawless balance sheet with proven track record.
Market Insights

Advertisement
Community Narratives
WhiteCap Is Positioned To Profit Regardless Of Trump's Policy 
Fair Value CA$22.60|61.6% undervalued
ST
Equity Analyst and Writer
Microsoft's Evolution Will Drive Revenue to New Heights Fueled by AI
Fair Value US$360.00|29.9% overvalued
BR
Community Contributor
A CASE FOR USD$2.50 (CAD$3.44) BY 2028 (A 5-10 BAGGER)
Fair Value CA$3.44|87.8% undervalued
AG
Community Contributor