
Advertisement
- South Korea
- /
- Electrical
- /
- KOSDAQ:A058610
Is SPG Co., Ltd.'s (KOSDAQ:058610) Stock Price Struggling As A Result Of Its Mixed Financials?

With its stock down 21% over the past three months, it is easy to disregard SPG (KOSDAQ:058610). We, however decided to study the company's financials to determine if they have got anything to do with the price decline. Long-term fundamentals are usually what drive market outcomes, so it's worth paying close attention. Specifically, we decided to study SPG's ROE in this article.
Return on equity or ROE is an important factor to be considered by a shareholder because it tells them how effectively their capital is being reinvested. In simpler terms, it measures the profitability of a company in relation to shareholder's equity.
How Is ROE Calculated?
Return on equity can be calculated by using the formula:
Return on Equity = Net Profit (from continuing operations) ÷ Shareholders' Equity
So, based on the above formula, the ROE for SPG is:
5.2% = ₩13b ÷ ₩254b (Based on the trailing twelve months to December 2024).
The 'return' is the profit over the last twelve months. One way to conceptualize this is that for each ₩1 of shareholders' capital it has, the company made ₩0.05 in profit.
View our latest analysis for SPG
Why Is ROE Important For Earnings Growth?
Thus far, we have learned that ROE measures how efficiently a company is generating its profits. Based on how much of its profits the company chooses to reinvest or "retain", we are then able to evaluate a company's future ability to generate profits. Assuming all else is equal, companies that have both a higher return on equity and higher profit retention are usually the ones that have a higher growth rate when compared to companies that don't have the same features.
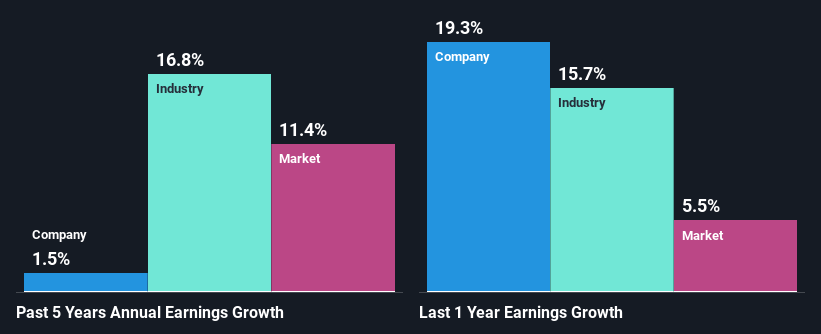
SPG's Earnings Growth And 5.2% ROE
On the face of it, SPG's ROE is not much to talk about. A quick further study shows that the company's ROE doesn't compare favorably to the industry average of 8.5% either. As a result, SPG's flat net income growth over the past five years doesn't come as a surprise given its lower ROE.
As a next step, we compared SPG's net income growth with the industry and were disappointed to see that the company's growth is lower than the industry average growth of 17% in the same period.
The basis for attaching value to a company is, to a great extent, tied to its earnings growth. The investor should try to establish if the expected growth or decline in earnings, whichever the case may be, is priced in. By doing so, they will have an idea if the stock is headed into clear blue waters or if swampy waters await. One good indicator of expected earnings growth is the P/E ratio which determines the price the market is willing to pay for a stock based on its earnings prospects. So, you may want to check if SPG is trading on a high P/E or a low P/E , relative to its industry.
Is SPG Making Efficient Use Of Its Profits?
Despite having a normal three-year median payout ratio of 49% (implying that the company keeps 51% of its income) over the last three years, SPG has seen a negligible amount of growth in earnings as we saw above. Therefore, there might be some other reasons to explain the lack in that respect. For example, the business could be in decline.
Additionally, SPG has paid dividends over a period of six years, which means that the company's management is determined to pay dividends even if it means little to no earnings growth.
Summary
On the whole, we feel that the performance shown by SPG can be open to many interpretations. While the company does have a high rate of reinvestment, the low ROE means that all that reinvestment is not reaping any benefit to its investors, and moreover, its having a negative impact on the earnings growth. Until now, we have only just grazed the surface of the company's past performance by looking at the company's fundamentals. To gain further insights into SPG's past profit growth, check out this visualization of past earnings, revenue and cash flows.
New: Manage All Your Stock Portfolios in One Place
We've created the ultimate portfolio companion for stock investors, and it's free.
• Connect an unlimited number of Portfolios and see your total in one currency
• Be alerted to new Warning Signs or Risks via email or mobile
• Track the Fair Value of your stocks
Have feedback on this article? Concerned about the content? Get in touch with us directly. Alternatively, email editorial-team (at) simplywallst.com.
This article by Simply Wall St is general in nature. We provide commentary based on historical data and analyst forecasts only using an unbiased methodology and our articles are not intended to be financial advice. It does not constitute a recommendation to buy or sell any stock, and does not take account of your objectives, or your financial situation. We aim to bring you long-term focused analysis driven by fundamental data. Note that our analysis may not factor in the latest price-sensitive company announcements or qualitative material. Simply Wall St has no position in any stocks mentioned.
About KOSDAQ:A058610
SPG
Manufactures and sells precision motors, industrial motors, and motors for home use in South Korea.
Excellent balance sheet with proven track record.
Market Insights

Advertisement
Community Narratives
MicroStrategy: Volatile Gamble or Golden Opportunity?
Fair Value US$663.00|31.9% undervalued
BL
Community Contributor
Emerging Markets and Debt Reduction Will Propel Bath & Body Works Forward
Fair Value US$40.73|22.1% undervalued
ZW
Community Contributor
An amazing opportunity to potentially get a 100 bagger
Fair Value US$10.00|36.0% overvalued
DA
Community Contributor