
Advertisement
- South Korea
- /
- Machinery
- /
- KOSDAQ:A044490
We Think TaewoongLtd (KOSDAQ:044490) Can Stay On Top Of Its Debt
Some say volatility, rather than debt, is the best way to think about risk as an investor, but Warren Buffett famously said that 'Volatility is far from synonymous with risk.' It's only natural to consider a company's balance sheet when you examine how risky it is, since debt is often involved when a business collapses. We note that Taewoong Co.,Ltd (KOSDAQ:044490) does have debt on its balance sheet. But is this debt a concern to shareholders?
When Is Debt A Problem?
Debt and other liabilities become risky for a business when it cannot easily fulfill those obligations, either with free cash flow or by raising capital at an attractive price. Ultimately, if the company can't fulfill its legal obligations to repay debt, shareholders could walk away with nothing. However, a more usual (but still expensive) situation is where a company must dilute shareholders at a cheap share price simply to get debt under control. Having said that, the most common situation is where a company manages its debt reasonably well - and to its own advantage. The first step when considering a company's debt levels is to consider its cash and debt together.
Check out our latest analysis for TaewoongLtd
How Much Debt Does TaewoongLtd Carry?
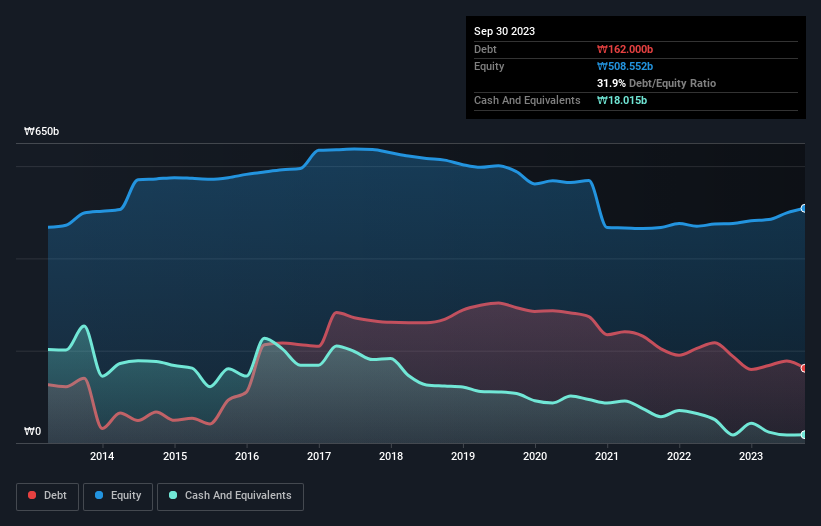
As you can see below, TaewoongLtd had ₩162.0b of debt at September 2023, down from ₩187.6b a year prior. However, it also had ₩18.0b in cash, and so its net debt is ₩144.0b.
How Healthy Is TaewoongLtd's Balance Sheet?
The latest balance sheet data shows that TaewoongLtd had liabilities of ₩130.2b due within a year, and liabilities of ₩143.0b falling due after that. Offsetting these obligations, it had cash of ₩18.0b as well as receivables valued at ₩202.3b due within 12 months. So its liabilities outweigh the sum of its cash and (near-term) receivables by ₩52.9b.
Of course, TaewoongLtd has a market capitalization of ₩341.9b, so these liabilities are probably manageable. Having said that, it's clear that we should continue to monitor its balance sheet, lest it change for the worse.
We use two main ratios to inform us about debt levels relative to earnings. The first is net debt divided by earnings before interest, tax, depreciation, and amortization (EBITDA), while the second is how many times its earnings before interest and tax (EBIT) covers its interest expense (or its interest cover, for short). Thus we consider debt relative to earnings both with and without depreciation and amortization expenses.
TaewoongLtd has a debt to EBITDA ratio of 2.7 and its EBIT covered its interest expense 4.6 times. Taken together this implies that, while we wouldn't want to see debt levels rise, we think it can handle its current leverage. Pleasingly, TaewoongLtd is growing its EBIT faster than former Australian PM Bob Hawke downs a yard glass, boasting a 383% gain in the last twelve months. The balance sheet is clearly the area to focus on when you are analysing debt. But it is TaewoongLtd's earnings that will influence how the balance sheet holds up in the future. So if you're keen to discover more about its earnings, it might be worth checking out this graph of its long term earnings trend.
Finally, a business needs free cash flow to pay off debt; accounting profits just don't cut it. So it's worth checking how much of that EBIT is backed by free cash flow. Over the last two years, TaewoongLtd reported free cash flow worth 16% of its EBIT, which is really quite low. For us, cash conversion that low sparks a little paranoia about is ability to extinguish debt.
Our View
When it comes to the balance sheet, the standout positive for TaewoongLtd was the fact that it seems able to grow its EBIT confidently. But the other factors we noted above weren't so encouraging. For example, its conversion of EBIT to free cash flow makes us a little nervous about its debt. When we consider all the elements mentioned above, it seems to us that TaewoongLtd is managing its debt quite well. Having said that, the load is sufficiently heavy that we would recommend any shareholders keep a close eye on it. Over time, share prices tend to follow earnings per share, so if you're interested in TaewoongLtd, you may well want to click here to check an interactive graph of its earnings per share history.
If, after all that, you're more interested in a fast growing company with a rock-solid balance sheet, then check out our list of net cash growth stocks without delay.
Valuation is complex, but we're here to simplify it.
Discover if TaewoongLtd might be undervalued or overvalued with our detailed analysis, featuring fair value estimates, potential risks, dividends, insider trades, and its financial condition.
Access Free AnalysisHave feedback on this article? Concerned about the content? Get in touch with us directly. Alternatively, email editorial-team (at) simplywallst.com.
This article by Simply Wall St is general in nature. We provide commentary based on historical data and analyst forecasts only using an unbiased methodology and our articles are not intended to be financial advice. It does not constitute a recommendation to buy or sell any stock, and does not take account of your objectives, or your financial situation. We aim to bring you long-term focused analysis driven by fundamental data. Note that our analysis may not factor in the latest price-sensitive company announcements or qualitative material. Simply Wall St has no position in any stocks mentioned.
About KOSDAQ:A044490
TaewoongLtd
Manufactures and sells open-die forgings and ring rolled products in South Korea and internationally.
Flawless balance sheet with reasonable growth potential.
Market Insights

Advertisement
Community Narratives
The Next Phase of Energy Storage: How NeoVolta Is Tackling America’s Power Crunch
Fair Value US$7.50|35.1% undervalued
MA
Community Contributor
Why EnSilica is Worth Possibly 13x its Current Price
Fair Value UK£5.00|89.8% undervalued
DO
Community Contributor
M&A Activity, Industry Diversification & A Defense Contract Monopoly Will Push BWXT For Healthy Long-Term Growth
Fair Value US$220.00|15.2% undervalued
CL
Community Contributor
A case for Cassiar Gold Corp (TSXV: GLDC) to reach CAD$8-10 before 2030 (X30-37)
Fair Value CA$10.00|96.0% undervalued
AG
Community Contributor