
Advertisement
- South Korea
- /
- Construction
- /
- KOSDAQ:A042940
Sangji Caelum (KOSDAQ:042940) Is Experiencing Growth In Returns On Capital

If we want to find a potential multi-bagger, often there are underlying trends that can provide clues. In a perfect world, we'd like to see a company investing more capital into its business and ideally the returns earned from that capital are also increasing. If you see this, it typically means it's a company with a great business model and plenty of profitable reinvestment opportunities. So when we looked at Sangji Caelum (KOSDAQ:042940) and its trend of ROCE, we really liked what we saw.
Understanding Return On Capital Employed (ROCE)
For those who don't know, ROCE is a measure of a company's yearly pre-tax profit (its return), relative to the capital employed in the business. The formula for this calculation on Sangji Caelum is:
Return on Capital Employed = Earnings Before Interest and Tax (EBIT) ÷ (Total Assets - Current Liabilities)
0.19 = ₩20b ÷ (₩231b - ₩126b) (Based on the trailing twelve months to September 2023).
Thus, Sangji Caelum has an ROCE of 19%. In absolute terms, that's a satisfactory return, but compared to the Construction industry average of 6.1% it's much better.
See our latest analysis for Sangji Caelum
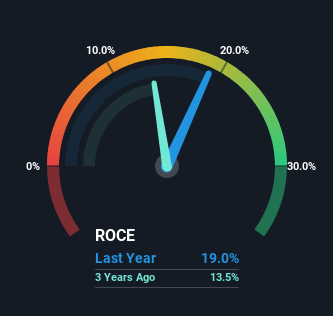
Historical performance is a great place to start when researching a stock so above you can see the gauge for Sangji Caelum's ROCE against it's prior returns. If you'd like to look at how Sangji Caelum has performed in the past in other metrics, you can view this free graph of Sangji Caelum's past earnings, revenue and cash flow.
What Can We Tell From Sangji Caelum's ROCE Trend?
The fact that Sangji Caelum is now generating some pre-tax profits from its prior investments is very encouraging. About five years ago the company was generating losses but things have turned around because it's now earning 19% on its capital. And unsurprisingly, like most companies trying to break into the black, Sangji Caelum is utilizing 139% more capital than it was five years ago. This can indicate that there's plenty of opportunities to invest capital internally and at ever higher rates, both common traits of a multi-bagger.
On a separate but related note, it's important to know that Sangji Caelum has a current liabilities to total assets ratio of 55%, which we'd consider pretty high. This can bring about some risks because the company is basically operating with a rather large reliance on its suppliers or other sorts of short-term creditors. Ideally we'd like to see this reduce as that would mean fewer obligations bearing risks.
The Bottom Line
To the delight of most shareholders, Sangji Caelum has now broken into profitability. And since the stock has dived 73% over the last five years, there may be other factors affecting the company's prospects. In any case, we believe the economic trends of this company are positive and looking into the stock further could prove rewarding.
Since virtually every company faces some risks, it's worth knowing what they are, and we've spotted 4 warning signs for Sangji Caelum (of which 1 is a bit concerning!) that you should know about.
While Sangji Caelum may not currently earn the highest returns, we've compiled a list of companies that currently earn more than 25% return on equity. Check out this free list here.
New: Manage All Your Stock Portfolios in One Place
We've created the ultimate portfolio companion for stock investors, and it's free.
• Connect an unlimited number of Portfolios and see your total in one currency
• Be alerted to new Warning Signs or Risks via email or mobile
• Track the Fair Value of your stocks
Have feedback on this article? Concerned about the content? Get in touch with us directly. Alternatively, email editorial-team (at) simplywallst.com.
This article by Simply Wall St is general in nature. We provide commentary based on historical data and analyst forecasts only using an unbiased methodology and our articles are not intended to be financial advice. It does not constitute a recommendation to buy or sell any stock, and does not take account of your objectives, or your financial situation. We aim to bring you long-term focused analysis driven by fundamental data. Note that our analysis may not factor in the latest price-sensitive company announcements or qualitative material. Simply Wall St has no position in any stocks mentioned.
About KOSDAQ:A042940
Excellent balance sheet low.
Market Insights

Advertisement
Community Narratives
MicroStrategy: Volatile Gamble or Golden Opportunity?
Fair Value US$663.00|35.7% undervalued
BL
Community Contributor
Emerging Markets and Debt Reduction Will Propel Bath & Body Works Forward
Fair Value US$40.73|20.5% undervalued
ZW
Community Contributor
An amazing opportunity to potentially get a 100 bagger
Fair Value US$10.00|25.2% overvalued
DA
Community Contributor