
Advertisement

Warren Buffett famously said, 'Volatility is far from synonymous with risk.' So it might be obvious that you need to consider debt, when you think about how risky any given stock is, because too much debt can sink a company. Importantly, CAS Corporation (KOSDAQ:016920) does carry debt. But the real question is whether this debt is making the company risky.
When Is Debt A Problem?
Debt assists a business until the business has trouble paying it off, either with new capital or with free cash flow. Part and parcel of capitalism is the process of 'creative destruction' where failed businesses are mercilessly liquidated by their bankers. However, a more common (but still painful) scenario is that it has to raise new equity capital at a low price, thus permanently diluting shareholders. By replacing dilution, though, debt can be an extremely good tool for businesses that need capital to invest in growth at high rates of return. The first step when considering a company's debt levels is to consider its cash and debt together.
What Is CAS's Debt?
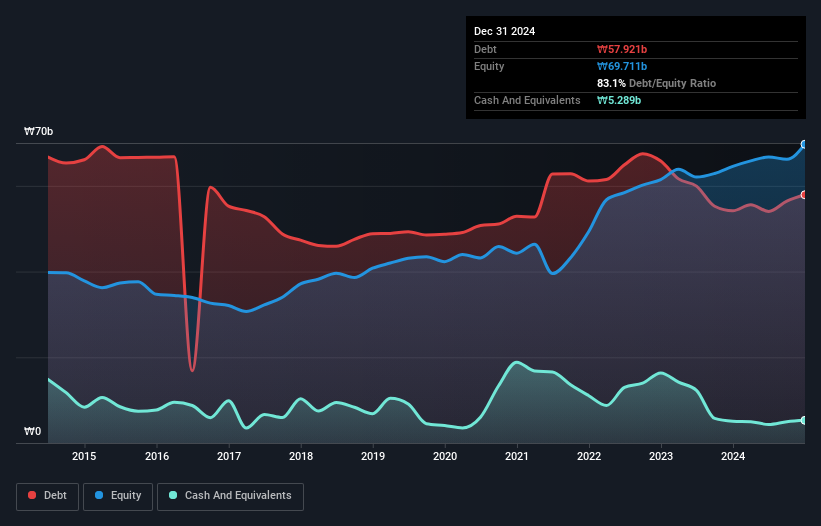
You can click the graphic below for the historical numbers, but it shows that as of December 2024 CAS had ₩57.9b of debt, an increase on ₩54.2b, over one year. On the flip side, it has ₩5.29b in cash leading to net debt of about ₩52.6b.
A Look At CAS' Liabilities
According to the last reported balance sheet, CAS had liabilities of ₩92.5b due within 12 months, and liabilities of ₩10.5b due beyond 12 months. On the other hand, it had cash of ₩5.29b and ₩44.5b worth of receivables due within a year. So its liabilities total ₩53.3b more than the combination of its cash and short-term receivables.
This deficit is considerable relative to its market capitalization of ₩57.3b, so it does suggest shareholders should keep an eye on CAS' use of debt. This suggests shareholders would be heavily diluted if the company needed to shore up its balance sheet in a hurry.
See our latest analysis for CAS
We measure a company's debt load relative to its earnings power by looking at its net debt divided by its earnings before interest, tax, depreciation, and amortization (EBITDA) and by calculating how easily its earnings before interest and tax (EBIT) cover its interest expense (interest cover). This way, we consider both the absolute quantum of the debt, as well as the interest rates paid on it.
Weak interest cover of 1.1 times and a disturbingly high net debt to EBITDA ratio of 7.2 hit our confidence in CAS like a one-two punch to the gut. The debt burden here is substantial. Worse, CAS's EBIT was down 29% over the last year. If earnings continue to follow that trajectory, paying off that debt load will be harder than convincing us to run a marathon in the rain. The balance sheet is clearly the area to focus on when you are analysing debt. But it is CAS's earnings that will influence how the balance sheet holds up in the future. So if you're keen to discover more about its earnings, it might be worth checking out this graph of its long term earnings trend .
Finally, a business needs free cash flow to pay off debt; accounting profits just don't cut it. So the logical step is to look at the proportion of that EBIT that is matched by actual free cash flow. Over the last three years, CAS reported free cash flow worth 9.0% of its EBIT, which is really quite low. That limp level of cash conversion undermines its ability to manage and pay down debt.
Our View
To be frank both CAS's interest cover and its track record of (not) growing its EBIT make us rather uncomfortable with its debt levels. And furthermore, its conversion of EBIT to free cash flow also fails to instill confidence. Taking into account all the aforementioned factors, it looks like CAS has too much debt. That sort of riskiness is ok for some, but it certainly doesn't float our boat. When analysing debt levels, the balance sheet is the obvious place to start. But ultimately, every company can contain risks that exist outside of the balance sheet. To that end, you should learn about the 3 warning signs we've spotted with CAS (including 2 which don't sit too well with us) .
At the end of the day, it's often better to focus on companies that are free from net debt. You can access our special list of such companies (all with a track record of profit growth). It's free.
New: AI Stock Screener & Alerts
Our new AI Stock Screener scans the market every day to uncover opportunities.
• Dividend Powerhouses (3%+ Yield)
• Undervalued Small Caps with Insider Buying
• High growth Tech and AI Companies
Or build your own from over 50 metrics.
Have feedback on this article? Concerned about the content? Get in touch with us directly. Alternatively, email editorial-team (at) simplywallst.com.
This article by Simply Wall St is general in nature. We provide commentary based on historical data and analyst forecasts only using an unbiased methodology and our articles are not intended to be financial advice. It does not constitute a recommendation to buy or sell any stock, and does not take account of your objectives, or your financial situation. We aim to bring you long-term focused analysis driven by fundamental data. Note that our analysis may not factor in the latest price-sensitive company announcements or qualitative material. Simply Wall St has no position in any stocks mentioned.
About KOSDAQ:A016920
Slight with questionable track record.
Similar Companies
Market Insights

Advertisement
Community Narratives
WhiteCap Is Positioned To Profit Regardless Of Trump's Policy 
Fair Value CA$22.60|61.6% undervalued
ST
Equity Analyst and Writer
Microsoft's Evolution Will Drive Revenue to New Heights Fueled by AI
Fair Value US$360.00|29.9% overvalued
BR
Community Contributor
A CASE FOR USD$2.50 (CAD$3.44) BY 2028 (A 5-10 BAGGER)
Fair Value CA$3.44|87.8% undervalued
AG
Community Contributor