
Advertisement
- South Korea
- /
- Machinery
- /
- KOSDAQ:A007820
SMCore.Inc's (KOSDAQ:007820) Profits Appear To Have Quality Issues

SMCore.Inc's (KOSDAQ:007820) robust recent earnings didn't do much to move the stock. We believe that shareholders have noticed some concerning factors beyond the statutory profit numbers.
A Closer Look At SMCore.Inc's Earnings
Many investors haven't heard of the accrual ratio from cashflow, but it is actually a useful measure of how well a company's profit is backed up by free cash flow (FCF) during a given period. In plain english, this ratio subtracts FCF from net profit, and divides that number by the company's average operating assets over that period. The ratio shows us how much a company's profit exceeds its FCF.
Therefore, it's actually considered a good thing when a company has a negative accrual ratio, but a bad thing if its accrual ratio is positive. While having an accrual ratio above zero is of little concern, we do think it's worth noting when a company has a relatively high accrual ratio. That's because some academic studies have suggested that high accruals ratios tend to lead to lower profit or less profit growth.
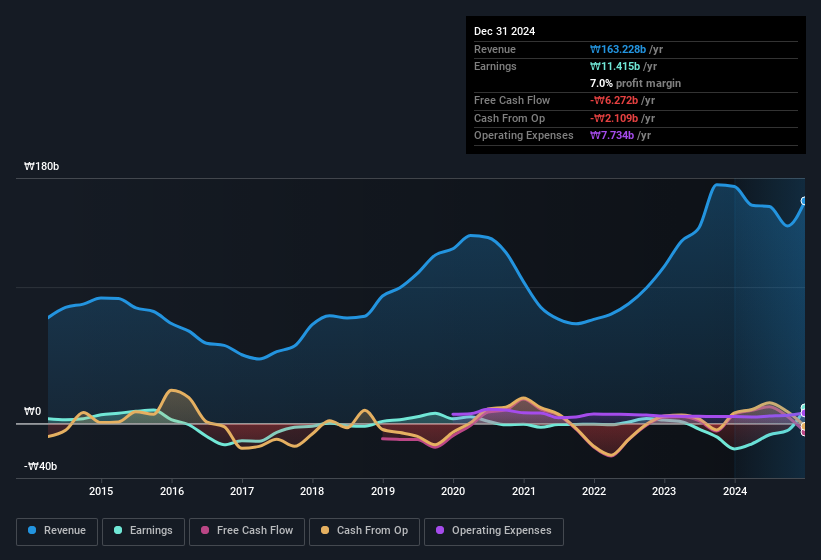
SMCore.Inc has an accrual ratio of 0.39 for the year to December 2024. Statistically speaking, that's a real negative for future earnings. To wit, the company did not generate one whit of free cashflow in that time. In the last twelve months it actually had negative free cash flow, with an outflow of ₩6.3b despite its profit of ₩11.4b, mentioned above. It's worth noting that SMCore.Inc generated positive FCF of ₩6.9b a year ago, so at least they've done it in the past. The good news for shareholders is that SMCore.Inc's accrual ratio was much better last year, so this year's poor reading might simply be a case of a short term mismatch between profit and FCF. As a result, some shareholders may be looking for stronger cash conversion in the current year.
Note: we always recommend investors check balance sheet strength. Click here to be taken to our balance sheet analysis of SMCore.Inc.
Our Take On SMCore.Inc's Profit Performance
As we discussed above, we think SMCore.Inc's earnings were not supported by free cash flow, which might concern some investors. As a result, we think it may well be the case that SMCore.Inc's underlying earnings power is lower than its statutory profit. On the bright side, the company showed enough improvement to book a profit this year, after losing money last year. The goal of this article has been to assess how well we can rely on the statutory earnings to reflect the company's potential, but there is plenty more to consider. With this in mind, we wouldn't consider investing in a stock unless we had a thorough understanding of the risks. Every company has risks, and we've spotted 3 warning signs for SMCore.Inc (of which 1 is a bit concerning!) you should know about.
Today we've zoomed in on a single data point to better understand the nature of SMCore.Inc's profit. But there is always more to discover if you are capable of focussing your mind on minutiae. For example, many people consider a high return on equity as an indication of favorable business economics, while others like to 'follow the money' and search out stocks that insiders are buying. So you may wish to see this free collection of companies boasting high return on equity, or this list of stocks with high insider ownership.
New: Manage All Your Stock Portfolios in One Place
We've created the ultimate portfolio companion for stock investors, and it's free.
• Connect an unlimited number of Portfolios and see your total in one currency
• Be alerted to new Warning Signs or Risks via email or mobile
• Track the Fair Value of your stocks
Have feedback on this article? Concerned about the content? Get in touch with us directly. Alternatively, email editorial-team (at) simplywallst.com.
This article by Simply Wall St is general in nature. We provide commentary based on historical data and analyst forecasts only using an unbiased methodology and our articles are not intended to be financial advice. It does not constitute a recommendation to buy or sell any stock, and does not take account of your objectives, or your financial situation. We aim to bring you long-term focused analysis driven by fundamental data. Note that our analysis may not factor in the latest price-sensitive company announcements or qualitative material. Simply Wall St has no position in any stocks mentioned.
About KOSDAQ:A007820
SMCore.Inc
Manufactures and sells smart automation systems in South Korea and internationally.
Adequate balance sheet and slightly overvalued.
Market Insights

Advertisement
Community Narratives
MicroStrategy: Volatile Gamble or Golden Opportunity?
Fair Value US$663.00|36.2% undervalued
BL
Community Contributor
Emerging Markets and Debt Reduction Will Propel Bath & Body Works Forward
Fair Value US$40.73|22.0% undervalued
ZW
Community Contributor
An amazing opportunity to potentially get a 100 bagger
Fair Value US$10.00|46.4% overvalued
DA
Community Contributor