- South Korea
- /
- Construction
- /
- KOSDAQ:A001840
What You Can Learn From EE-HWA Construction Co., Ltd.'s (KOSDAQ:001840) P/S After Its 29% Share Price Crash


The EE-HWA Construction Co., Ltd. (KOSDAQ:001840) share price has softened a substantial 29% over the previous 30 days, handing back much of the gains the stock has made lately. Instead of being rewarded, shareholders who have already held through the last twelve months are now sitting on a 28% share price drop.
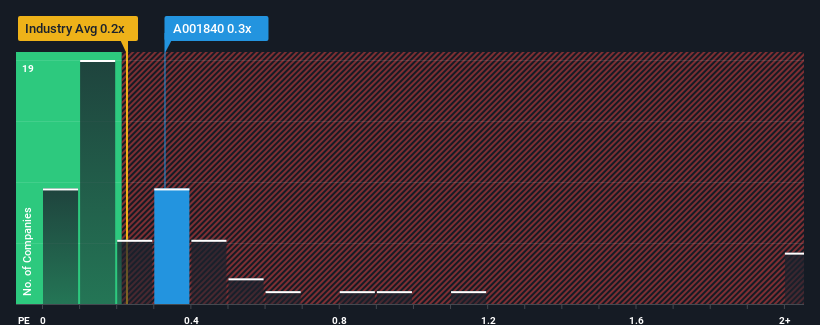
Even after such a large drop in price, there still wouldn't be many who think EE-HWA Construction's price-to-sales (or "P/S") ratio of 0.3x is worth a mention when the median P/S in Korea's Construction industry is similar at about 0.2x. Although, it's not wise to simply ignore the P/S without explanation as investors may be disregarding a distinct opportunity or a costly mistake.
Check out our latest analysis for EE-HWA Construction
What Does EE-HWA Construction's Recent Performance Look Like?
Revenue has risen at a steady rate over the last year for EE-HWA Construction, which is generally not a bad outcome. One possibility is that the P/S is moderate because investors think this good revenue growth might only be parallel to the broader industry in the near future. If you like the company, you'd be hoping this isn't the case so that you could potentially pick up some stock while it's not quite in favour.
We don't have analyst forecasts, but you can see how recent trends are setting up the company for the future by checking out our free report on EE-HWA Construction's earnings, revenue and cash flow.What Are Revenue Growth Metrics Telling Us About The P/S?
The only time you'd be comfortable seeing a P/S like EE-HWA Construction's is when the company's growth is tracking the industry closely.
Retrospectively, the last year delivered a decent 6.2% gain to the company's revenues. However, due to its less than impressive performance prior to this period, revenue growth is practically non-existent over the last three years overall. Accordingly, shareholders probably wouldn't have been overly satisfied with the unstable medium-term growth rates.
Weighing that recent medium-term revenue trajectory against the broader industry's one-year forecast for expansion of 1.0% shows it's about the same on an annualised basis.
With this information, we can see why EE-HWA Construction is trading at a fairly similar P/S to the industry. It seems most investors are expecting to see average growth rates continue into the future and are only willing to pay a moderate amount for the stock.
What Does EE-HWA Construction's P/S Mean For Investors?
With its share price dropping off a cliff, the P/S for EE-HWA Construction looks to be in line with the rest of the Construction industry. While the price-to-sales ratio shouldn't be the defining factor in whether you buy a stock or not, it's quite a capable barometer of revenue expectations.
As we've seen, EE-HWA Construction's three-year revenue trends seem to be contributing to its P/S, given they look similar to current industry expectations. With previous revenue trends that keep up with the current industry outlook, it's hard to justify the company's P/S ratio deviating much from it's current point. If recent medium-term revenue trends continue, it's hard to see the share price moving strongly in either direction in the near future under these circumstances.
It is also worth noting that we have found 3 warning signs for EE-HWA Construction (2 are a bit unpleasant!) that you need to take into consideration.
If these risks are making you reconsider your opinion on EE-HWA Construction, explore our interactive list of high quality stocks to get an idea of what else is out there.
Valuation is complex, but we're here to simplify it.
Discover if EE-HWA Construction might be undervalued or overvalued with our detailed analysis, featuring fair value estimates, potential risks, dividends, insider trades, and its financial condition.
Access Free AnalysisHave feedback on this article? Concerned about the content? Get in touch with us directly. Alternatively, email editorial-team (at) simplywallst.com.
This article by Simply Wall St is general in nature. We provide commentary based on historical data and analyst forecasts only using an unbiased methodology and our articles are not intended to be financial advice. It does not constitute a recommendation to buy or sell any stock, and does not take account of your objectives, or your financial situation. We aim to bring you long-term focused analysis driven by fundamental data. Note that our analysis may not factor in the latest price-sensitive company announcements or qualitative material. Simply Wall St has no position in any stocks mentioned.
About KOSDAQ:A001840
Adequate balance sheet low.
Market Insights

Community Narratives


