
Advertisement
- South Korea
- /
- Auto Components
- /
- KOSDAQ:A071850
Castec Korea Co.,Ltd (KOSDAQ:071850) Shares Slammed 26% But Getting In Cheap Might Be Difficult Regardless
To the annoyance of some shareholders, Castec Korea Co.,Ltd (KOSDAQ:071850) shares are down a considerable 26% in the last month, which continues a horrid run for the company. Instead of being rewarded, shareholders who have already held through the last twelve months are now sitting on a 49% share price drop.
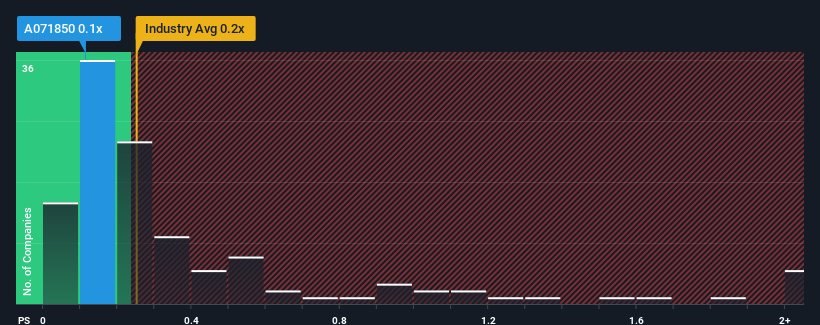
Even after such a large drop in price, you could still be forgiven for feeling indifferent about Castec KoreaLtd's P/S ratio of 0.1x, since the median price-to-sales (or "P/S") ratio for the Auto Components industry in Korea is also close to 0.2x. While this might not raise any eyebrows, if the P/S ratio is not justified investors could be missing out on a potential opportunity or ignoring looming disappointment.
See our latest analysis for Castec KoreaLtd
How Has Castec KoreaLtd Performed Recently?
For instance, Castec KoreaLtd's receding revenue in recent times would have to be some food for thought. It might be that many expect the company to put the disappointing revenue performance behind them over the coming period, which has kept the P/S from falling. If you like the company, you'd at least be hoping this is the case so that you could potentially pick up some stock while it's not quite in favour.
Although there are no analyst estimates available for Castec KoreaLtd, take a look at this free data-rich visualisation to see how the company stacks up on earnings, revenue and cash flow.What Are Revenue Growth Metrics Telling Us About The P/S?
The only time you'd be comfortable seeing a P/S like Castec KoreaLtd's is when the company's growth is tracking the industry closely.
In reviewing the last year of financials, we were disheartened to see the company's revenues fell to the tune of 12%. This has soured the latest three-year period, which nevertheless managed to deliver a decent 15% overall rise in revenue. Although it's been a bumpy ride, it's still fair to say the revenue growth recently has been mostly respectable for the company.
Weighing that recent medium-term revenue trajectory against the broader industry's one-year forecast for expansion of 4.3% shows it's about the same on an annualised basis.
In light of this, it's understandable that Castec KoreaLtd's P/S sits in line with the majority of other companies. It seems most investors are expecting to see average growth rates continue into the future and are only willing to pay a moderate amount for the stock.
The Key Takeaway
With its share price dropping off a cliff, the P/S for Castec KoreaLtd looks to be in line with the rest of the Auto Components industry. We'd say the price-to-sales ratio's power isn't primarily as a valuation instrument but rather to gauge current investor sentiment and future expectations.
As we've seen, Castec KoreaLtd's three-year revenue trends seem to be contributing to its P/S, given they look similar to current industry expectations. Right now shareholders are comfortable with the P/S as they are quite confident future revenue won't throw up any surprises. Given the current circumstances, it seems improbable that the share price will experience any significant movement in either direction in the near future if recent medium-term revenue trends persist.
Before you take the next step, you should know about the 3 warning signs for Castec KoreaLtd (1 shouldn't be ignored!) that we have uncovered.
Of course, profitable companies with a history of great earnings growth are generally safer bets. So you may wish to see this free collection of other companies that have reasonable P/E ratios and have grown earnings strongly.
New: AI Stock Screener & Alerts
Our new AI Stock Screener scans the market every day to uncover opportunities.
• Dividend Powerhouses (3%+ Yield)
• Undervalued Small Caps with Insider Buying
• High growth Tech and AI Companies
Or build your own from over 50 metrics.
Have feedback on this article? Concerned about the content? Get in touch with us directly. Alternatively, email editorial-team (at) simplywallst.com.
This article by Simply Wall St is general in nature. We provide commentary based on historical data and analyst forecasts only using an unbiased methodology and our articles are not intended to be financial advice. It does not constitute a recommendation to buy or sell any stock, and does not take account of your objectives, or your financial situation. We aim to bring you long-term focused analysis driven by fundamental data. Note that our analysis may not factor in the latest price-sensitive company announcements or qualitative material. Simply Wall St has no position in any stocks mentioned.
Have feedback on this article? Concerned about the content? Get in touch with us directly. Alternatively, email editorial-team@simplywallst.com
About KOSDAQ:A071850
Castec KoreaLtd
Engages in the manufacture and sale of automobile components in South Korea.
Mediocre balance sheet with minimal risk.
Market Insights

Advertisement
Community Narratives
MINISO's fair value is projected at 26.69 with an anticipated PE ratio shift of 20x
Fair Value US$24.03|11.0% undervalued
BE
Community Contributor
Procter & Gamble: A Dividend Giant Facing Slowing Growth
Fair Value US$119.81|23.3% overvalued
AN
Community Contributor
Eli Lilly's Future Growth Driven by Tirzepatide and Favorable Market Conditions
Fair Value US$1.19k|13.8% undervalued
EA
Community Contributor