
Advertisement
- South Korea
- /
- Auto Components
- /
- KOSDAQ:A013310
Impressive Earnings May Not Tell The Whole Story For A-Jin IndustrialLtd (KOSDAQ:013310)
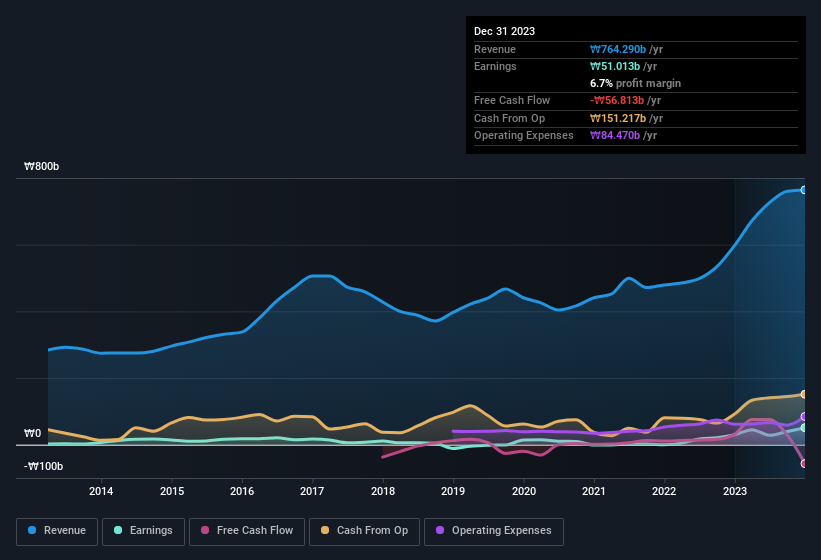
A-Jin Industrial Co.,Ltd.'s (KOSDAQ:013310) robust earnings report didn't manage to move the market for its stock. Our analysis suggests that shareholders have noticed something concerning in the numbers.
Check out our latest analysis for A-Jin IndustrialLtd
Examining Cashflow Against A-Jin IndustrialLtd's Earnings
As finance nerds would already know, the accrual ratio from cashflow is a key measure for assessing how well a company's free cash flow (FCF) matches its profit. The accrual ratio subtracts the FCF from the profit for a given period, and divides the result by the average operating assets of the company over that time. The ratio shows us how much a company's profit exceeds its FCF.
That means a negative accrual ratio is a good thing, because it shows that the company is bringing in more free cash flow than its profit would suggest. While it's not a problem to have a positive accrual ratio, indicating a certain level of non-cash profits, a high accrual ratio is arguably a bad thing, because it indicates paper profits are not matched by cash flow. That's because some academic studies have suggested that high accruals ratios tend to lead to lower profit or less profit growth.
A-Jin IndustrialLtd has an accrual ratio of 0.20 for the year to December 2023. We can therefore deduce that its free cash flow fell well short of covering its statutory profit. In the last twelve months it actually had negative free cash flow, with an outflow of ₩57b despite its profit of ₩51.0b, mentioned above. We saw that FCF was ₩32b a year ago though, so A-Jin IndustrialLtd has at least been able to generate positive FCF in the past. One positive for A-Jin IndustrialLtd shareholders is that it's accrual ratio was significantly better last year, providing reason to believe that it may return to stronger cash conversion in the future. Shareholders should look for improved cashflow relative to profit in the current year, if that is indeed the case.
Note: we always recommend investors check balance sheet strength. Click here to be taken to our balance sheet analysis of A-Jin IndustrialLtd.
Our Take On A-Jin IndustrialLtd's Profit Performance
A-Jin IndustrialLtd didn't convert much of its profit to free cash flow in the last year, which some investors may consider rather suboptimal. Because of this, we think that it may be that A-Jin IndustrialLtd's statutory profits are better than its underlying earnings power. But at least holders can take some solace from the 72% EPS growth in the last year. Of course, we've only just scratched the surface when it comes to analysing its earnings; one could also consider margins, forecast growth, and return on investment, among other factors. If you'd like to know more about A-Jin IndustrialLtd as a business, it's important to be aware of any risks it's facing. When we did our research, we found 3 warning signs for A-Jin IndustrialLtd (1 is potentially serious!) that we believe deserve your full attention.
This note has only looked at a single factor that sheds light on the nature of A-Jin IndustrialLtd's profit. But there is always more to discover if you are capable of focussing your mind on minutiae. For example, many people consider a high return on equity as an indication of favorable business economics, while others like to 'follow the money' and search out stocks that insiders are buying. So you may wish to see this free collection of companies boasting high return on equity, or this list of stocks that insiders are buying.
New: Manage All Your Stock Portfolios in One Place
We've created the ultimate portfolio companion for stock investors, and it's free.
• Connect an unlimited number of Portfolios and see your total in one currency
• Be alerted to new Warning Signs or Risks via email or mobile
• Track the Fair Value of your stocks
Have feedback on this article? Concerned about the content? Get in touch with us directly. Alternatively, email editorial-team (at) simplywallst.com.
This article by Simply Wall St is general in nature. We provide commentary based on historical data and analyst forecasts only using an unbiased methodology and our articles are not intended to be financial advice. It does not constitute a recommendation to buy or sell any stock, and does not take account of your objectives, or your financial situation. We aim to bring you long-term focused analysis driven by fundamental data. Note that our analysis may not factor in the latest price-sensitive company announcements or qualitative material. Simply Wall St has no position in any stocks mentioned.
About KOSDAQ:A013310
A-Jin IndustrialLtd
Engages in the manufacture and sale of automotive parts in South Korea and internationally.
Medium-low risk unattractive dividend payer.
Market Insights

Advertisement
Weekly Picks
RO


RockeTeller on Santacruz Silver Mining ·
Crazy Undervalued 42 Baggers Silver Play (Active & Running Mine)
Fair Value:CA$8696.7% undervalued
54 followersusers have followed this narrative
6 commentsusers have commented on this narrative
17 likesusers have liked this narrative
RO


Robbo on Fiducian Group ·
Fiducian: Compliance Clouds or Value Opportunity?
Fair Value:AU$122.0% undervalued
9 followersusers have followed this narrative
0 commentsusers have commented on this narrative
0 likesusers have liked this narrative
WO

woodworthfund on Willamette Valley Vineyards ·
Willamette Valley Vineyards (WVVI): Not-So-Great Value
Fair Value:US$242.5% overvalued
10 followersusers have followed this narrative
0 commentsusers have commented on this narrative
1 likeusers have liked this narrative
Recently Updated Narratives
DA


davidlsander on Beam Therapeutics ·
The "Molecular Pencil": Why Beam's Technology is Built to Win
Fair Value:US$15081.9% undervalued
49 followersusers have followed this narrative
3 commentsusers have commented on this narrative
1 likeusers have liked this narrative
MO


mo7md on ADNOC Gas ·
ADNOC Gas future shines with a 21.4% revenue surge
Fair Value:د.إ3.728.9% undervalued
2 followersusers have followed this narrative
0 commentsusers have commented on this narrative
0 likesusers have liked this narrative
IN

IncomeAssets on Pulse Seismic ·
Watch Pulse Seismic Outperform with 13.6% Revenue Growth in the Coming Years
Fair Value:CA$4.4727.3% undervalued
4 followersusers have followed this narrative
0 commentsusers have commented on this narrative
0 likesusers have liked this narrative
Popular Narratives
TH


TheWallstreetKing on MicroVision ·
MicroVision will explode future revenue by 380.37% with a vision towards success
Fair Value:US$6098.5% undervalued
116 followersusers have followed this narrative
11 commentsusers have commented on this narrative
22 likesusers have liked this narrative
AN


AnalystConsensusTarget on NVIDIA ·
NVDA: Expanding AI Demand Will Drive Major Data Center Investments Through 2026
Fair Value:US$250.3927.2% undervalued
957 followersusers have followed this narrative
6 commentsusers have commented on this narrative
25 likesusers have liked this narrative
RO
RockeTeller on Santacruz Silver Mining ·
Crazy Undervalued 42 Baggers Silver Play (Active & Running Mine)
Fair Value:CA$8696.7% undervalued
54 followersusers have followed this narrative
6 commentsusers have commented on this narrative
17 likesusers have liked this narrative

