
Advertisement
- Japan
- /
- Electric Utilities
- /
- TSE:7692
Why We're Not Concerned Yet About Earth Infinity Co.Ltd.'s (TSE:7692) 30% Share Price Plunge
Earth Infinity Co.Ltd. (TSE:7692) shares have retraced a considerable 30% in the last month, reversing a fair amount of their solid recent performance. The recent drop completes a disastrous twelve months for shareholders, who are sitting on a 50% loss during that time.
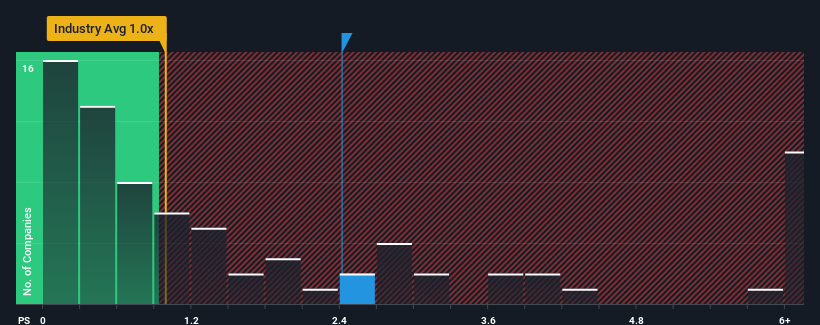
Although its price has dipped substantially, given around half the companies in Japan's Electric Utilities industry have price-to-sales ratios (or "P/S") below 0.3x, you may still consider Earth InfinityLtd as a stock to avoid entirely with its 2.4x P/S ratio. Nonetheless, we'd need to dig a little deeper to determine if there is a rational basis for the highly elevated P/S.
See our latest analysis for Earth InfinityLtd
What Does Earth InfinityLtd's Recent Performance Look Like?
For instance, Earth InfinityLtd's receding revenue in recent times would have to be some food for thought. Perhaps the market believes the company can do enough to outperform the rest of the industry in the near future, which is keeping the P/S ratio high. If not, then existing shareholders may be quite nervous about the viability of the share price.
We don't have analyst forecasts, but you can see how recent trends are setting up the company for the future by checking out our free report on Earth InfinityLtd's earnings, revenue and cash flow.How Is Earth InfinityLtd's Revenue Growth Trending?
The only time you'd be truly comfortable seeing a P/S as steep as Earth InfinityLtd's is when the company's growth is on track to outshine the industry decidedly.
In reviewing the last year of financials, we were disheartened to see the company's revenues fell to the tune of 17%. That put a dampener on the good run it was having over the longer-term as its three-year revenue growth is still a noteworthy 24% in total. Accordingly, while they would have preferred to keep the run going, shareholders would be roughly satisfied with the medium-term rates of revenue growth.
Comparing that to the industry, which is predicted to shrink 5.6% in the next 12 months, the company's positive momentum based on recent medium-term revenue results is a bright spot for the moment.
With this in mind, it's clear to us why Earth InfinityLtd's P/S exceeds that of its industry peers. Presumably shareholders aren't keen to offload something they believe will continue to outmanoeuvre the industry. Nonetheless, with most other businesses facing an uphill battle, staying on its current revenue path is no certainty.
The Key Takeaway
Earth InfinityLtd's shares may have suffered, but its P/S remains high. Typically, we'd caution against reading too much into price-to-sales ratios when settling on investment decisions, though it can reveal plenty about what other market participants think about the company.
As detailed previously, the strength of Earth InfinityLtd's recent revenue trends over the medium-term relative to a declining industry is part of the reason why it trades at a higher P/S than its industry counterparts. It could be said that investors feel this revenue growth will continue into the future, justifying a higher P/S ratio. However, it'd be fair to raise concerns over whether this level of revenue performance will continue given the harsh conditions facing the industry. Otherwise, it's hard to see the share price falling strongly in the near future if its revenue performance persists.
Before you take the next step, you should know about the 5 warning signs for Earth InfinityLtd (2 can't be ignored!) that we have uncovered.
If companies with solid past earnings growth is up your alley, you may wish to see this free collection of other companies with strong earnings growth and low P/E ratios.
Valuation is complex, but we're here to simplify it.
Discover if Earth InfinityLtd might be undervalued or overvalued with our detailed analysis, featuring fair value estimates, potential risks, dividends, insider trades, and its financial condition.
Access Free AnalysisHave feedback on this article? Concerned about the content? Get in touch with us directly. Alternatively, email editorial-team (at) simplywallst.com.
This article by Simply Wall St is general in nature. We provide commentary based on historical data and analyst forecasts only using an unbiased methodology and our articles are not intended to be financial advice. It does not constitute a recommendation to buy or sell any stock, and does not take account of your objectives, or your financial situation. We aim to bring you long-term focused analysis driven by fundamental data. Note that our analysis may not factor in the latest price-sensitive company announcements or qualitative material. Simply Wall St has no position in any stocks mentioned.
About TSE:7692
Earth InfinityLtd
Engages in the electricity and gas retail businesses in Japan.
Outstanding track record with excellent balance sheet.
Market Insights

Advertisement
Community Narratives
MicroVision will explode future revenue by 380.37% with a vision towards success
Fair Value US$60.00|98.4% undervalued
TH
Community Contributor
The Indispensable Artery for a New North American Economy
Fair Value CA$132.87|1.3% undervalued
TI
Community Contributor