
Advertisement
- Japan
- /
- Gas Utilities
- /
- TSE:1663
K&O Energy Group Inc. (TSE:1663) Stock Catapults 28% Though Its Price And Business Still Lag The Market
Despite an already strong run, K&O Energy Group Inc. (TSE:1663) shares have been powering on, with a gain of 28% in the last thirty days. Looking back a bit further, it's encouraging to see the stock is up 42% in the last year.
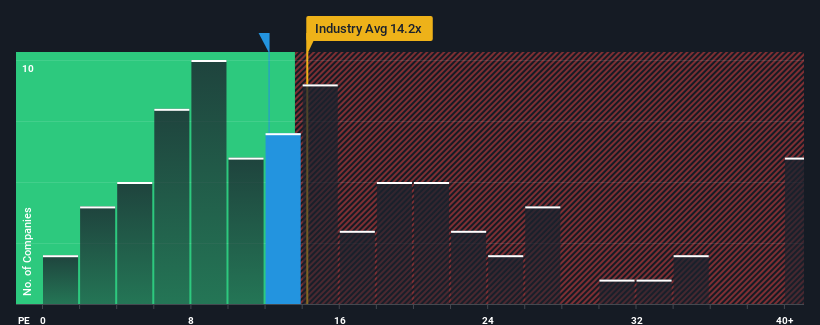
In spite of the firm bounce in price, K&O Energy Group's price-to-earnings (or "P/E") ratio of 12.2x might still make it look like a buy right now compared to the market in Japan, where around half of the companies have P/E ratios above 15x and even P/E's above 24x are quite common. Nonetheless, we'd need to dig a little deeper to determine if there is a rational basis for the reduced P/E.
Recent times have been advantageous for K&O Energy Group as its earnings have been rising faster than most other companies. One possibility is that the P/E is low because investors think this strong earnings performance might be less impressive moving forward. If not, then existing shareholders have reason to be quite optimistic about the future direction of the share price.
See our latest analysis for K&O Energy Group
Does Growth Match The Low P/E?
K&O Energy Group's P/E ratio would be typical for a company that's only expected to deliver limited growth, and importantly, perform worse than the market.
Retrospectively, the last year delivered an exceptional 35% gain to the company's bottom line. Pleasingly, EPS has also lifted 127% in aggregate from three years ago, thanks to the last 12 months of growth. Accordingly, shareholders would have probably welcomed those medium-term rates of earnings growth.
Turning to the outlook, the next three years should bring diminished returns, with earnings decreasing 8.2% per annum as estimated by the only analyst watching the company. Meanwhile, the broader market is forecast to expand by 10% per year, which paints a poor picture.
With this information, we are not surprised that K&O Energy Group is trading at a P/E lower than the market. Nonetheless, there's no guarantee the P/E has reached a floor yet with earnings going in reverse. There's potential for the P/E to fall to even lower levels if the company doesn't improve its profitability.
What We Can Learn From K&O Energy Group's P/E?
Despite K&O Energy Group's shares building up a head of steam, its P/E still lags most other companies. We'd say the price-to-earnings ratio's power isn't primarily as a valuation instrument but rather to gauge current investor sentiment and future expectations.
As we suspected, our examination of K&O Energy Group's analyst forecasts revealed that its outlook for shrinking earnings is contributing to its low P/E. Right now shareholders are accepting the low P/E as they concede future earnings probably won't provide any pleasant surprises. Unless these conditions improve, they will continue to form a barrier for the share price around these levels.
There are also other vital risk factors to consider before investing and we've discovered 1 warning sign for K&O Energy Group that you should be aware of.
If you're unsure about the strength of K&O Energy Group's business, why not explore our interactive list of stocks with solid business fundamentals for some other companies you may have missed.
Valuation is complex, but we're here to simplify it.
Discover if K&O Energy Group might be undervalued or overvalued with our detailed analysis, featuring fair value estimates, potential risks, dividends, insider trades, and its financial condition.
Access Free AnalysisHave feedback on this article? Concerned about the content? Get in touch with us directly. Alternatively, email editorial-team (at) simplywallst.com.
This article by Simply Wall St is general in nature. We provide commentary based on historical data and analyst forecasts only using an unbiased methodology and our articles are not intended to be financial advice. It does not constitute a recommendation to buy or sell any stock, and does not take account of your objectives, or your financial situation. We aim to bring you long-term focused analysis driven by fundamental data. Note that our analysis may not factor in the latest price-sensitive company announcements or qualitative material. Simply Wall St has no position in any stocks mentioned.
About TSE:1663
K&O Energy Group
Engages in the development, production, supply, and sale of natural gas and iodine in Japan.
Flawless balance sheet average dividend payer.
Market Insights

Advertisement
Community Narratives
MicroVision will explode future revenue by 380.37% with a vision towards success
Fair Value US$60|98.4% undervalued
TH
Community Contributor
The Indispensable Artery for a New North American Economy
Fair Value CA$132.87|0.8% undervalued
TI
Community Contributor
Recently Updated Narratives
CO

composite32 on TAV Havalimanlari Holding ·
TAV Havalimanlari Holding will fly high with 25.68% revenue growth
Fair Value:₺545.1648.6% undervalued
2 followersusers have followed this narrative
0 commentsusers have commented on this narrative
0 likesusers have liked this narrative
RO


Robbo on Fiducian Group ·
Fiducian: Compliance Clouds or Value Opportunity?
Fair Value:AU$122.3% overvalued
1 followerusers have followed this narrative
0 commentsusers have commented on this narrative
0 likesusers have liked this narrative
MA


MarkoVT on COVER ·
Q3 Outlook modestly optimistic
Fair Value:JP¥1.65k2.0% overvalued
1 followerusers have followed this narrative
0 commentsusers have commented on this narrative
0 likesusers have liked this narrative
Popular Narratives
TH

TheWallstreetKing on MicroVision ·
MicroVision will explode future revenue by 380.37% with a vision towards success
Fair Value:US$6098.4% undervalued
92 followersusers have followed this narrative
10 commentsusers have commented on this narrative
18 likesusers have liked this narrative
OS


oscargarcia on Alphabet ·
The company that turned a verb into a global necessity and basically runs the modern internet, digital ads, smartphones, maps, and AI.
Fair Value:US$3405.9% undervalued
136 followersusers have followed this narrative
6 commentsusers have commented on this narrative
18 likesusers have liked this narrative
AN


AnalystConsensusTarget on NVIDIA ·
NVDA: Expanding AI Demand Will Drive Major Data Center Investments Through 2026
Fair Value:US$232.7922.6% undervalued
927 followersusers have followed this narrative
6 commentsusers have commented on this narrative
22 likesusers have liked this narrative