We can readily understand why investors are attracted to unprofitable companies. For example, although software-as-a-service business Salesforce.com lost money for years while it grew recurring revenue, if you held shares since 2005, you'd have done very well indeed. But the harsh reality is that very many loss making companies burn through all their cash and go bankrupt.
So should FHT holdings (TYO:3777) shareholders be worried about its cash burn? For the purposes of this article, cash burn is the annual rate at which an unprofitable company spends cash to fund its growth; its negative free cash flow. The first step is to compare its cash burn with its cash reserves, to give us its 'cash runway'.
View our latest analysis for FHT holdings
How Long Is FHT holdings' Cash Runway?
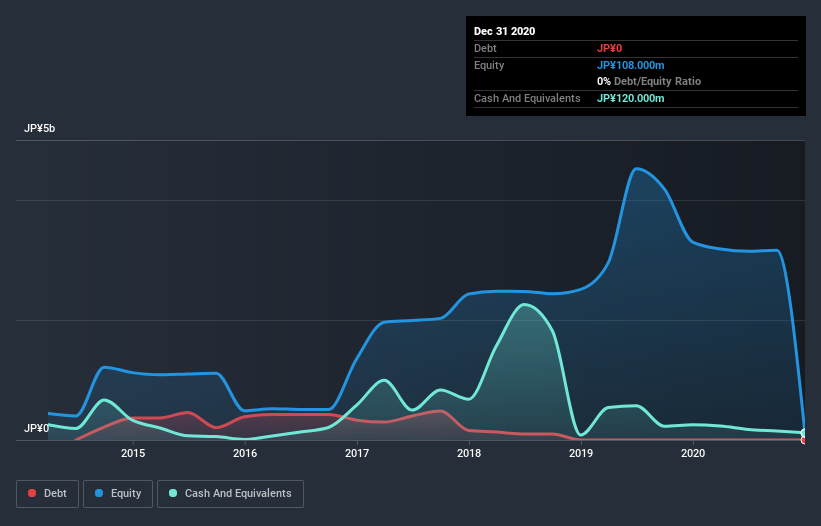
A cash runway is defined as the length of time it would take a company to run out of money if it kept spending at its current rate of cash burn. In December 2020, FHT holdings had JP¥120m in cash, and was debt-free. Importantly, its cash burn was JP¥144m over the trailing twelve months. That means it had a cash runway of around 10 months as of December 2020. To be frank, this kind of short runway puts us on edge, as it indicates the company must reduce its cash burn significantly, or else raise cash imminently. Depicted below, you can see how its cash holdings have changed over time.

Is FHT holdings' Revenue Growing?
We're hesitant to extrapolate on the recent trend to assess its cash burn, because FHT holdings actually had positive free cash flow last year, so operating revenue growth is probably our best bet to measure, right now. Unfortunately, the last year has been a disappointment, with operating revenue dropping 47% during the period. In reality, this article only makes a short study of the company's growth data. You can take a look at how FHT holdings has developed its business over time by checking this visualization of its revenue and earnings history.
How Easily Can FHT holdings Raise Cash?
Given its problematic fall in revenue, FHT holdings shareholders should consider how the company could fund its growth, if it turns out it needs more cash. Companies can raise capital through either debt or equity. One of the main advantages held by publicly listed companies is that they can sell shares to investors to raise cash and fund growth. By looking at a company's cash burn relative to its market capitalisation, we gain insight on how much shareholders would be diluted if the company needed to raise enough cash to cover another year's cash burn.
FHT holdings has a market capitalisation of JP¥3.0b and burnt through JP¥144m last year, which is 4.7% of the company's market value. Given that is a rather small percentage, it would probably be really easy for the company to fund another year's growth by issuing some new shares to investors, or even by taking out a loan.
How Risky Is FHT holdings' Cash Burn Situation?
Even though its falling revenue makes us a little nervous, we are compelled to mention that we thought FHT holdings' cash burn relative to its market cap was relatively promising. We don't think its cash burn is particularly problematic, but after considering the range of factors in this article, we do think shareholders should be monitoring how it changes over time. On another note, we conducted an in-depth investigation of the company, and identified 6 warning signs for FHT holdings (2 make us uncomfortable!) that you should be aware of before investing here.
Of course, you might find a fantastic investment by looking elsewhere. So take a peek at this free list of companies insiders are buying, and this list of stocks growth stocks (according to analyst forecasts)
If you decide to trade FHT holdings, use the lowest-cost* platform that is rated #1 Overall by Barron’s, Interactive Brokers. Trade stocks, options, futures, forex, bonds and funds on 135 markets, all from a single integrated account. Promoted
Valuation is complex, but we're here to simplify it.
Discover if Environment Friendly Holdings might be undervalued or overvalued with our detailed analysis, featuring fair value estimates, potential risks, dividends, insider trades, and its financial condition.
Access Free AnalysisThis article by Simply Wall St is general in nature. It does not constitute a recommendation to buy or sell any stock, and does not take account of your objectives, or your financial situation. We aim to bring you long-term focused analysis driven by fundamental data. Note that our analysis may not factor in the latest price-sensitive company announcements or qualitative material. Simply Wall St has no position in any stocks mentioned.
*Interactive Brokers Rated Lowest Cost Broker by StockBrokers.com Annual Online Review 2020
Have feedback on this article? Concerned about the content? Get in touch with us directly. Alternatively, email editorial-team (at) simplywallst.com.
About TSE:3777
Excellent balance sheet with very low risk.
Market Insights
Weekly Picks


MicroVision will explode future revenue by 380.37% with a vision towards success


The Indispensable Artery for a New North American Economy

Agfa-Gevaert is a digital and materials turnaround opportunity, with growth potential in ZIRFON, but carrying legacy risks.
Recently Updated Narratives


Engineered for Stability. Positioned for Growth.


MINISO's fair value is projected at 26.69 with an anticipated PE ratio shift of 20x


Fiverr International will transform the freelance industry with AI-powered growth
Popular Narratives


MicroVision will explode future revenue by 380.37% with a vision towards success


NVDA: Expanding AI Demand Will Drive Major Data Center Investments Through 2026


