
Advertisement
- Japan
- /
- Infrastructure
- /
- TSE:9377
Is AGP Corporation's (TSE:9377) Recent Stock Performance Tethered To Its Strong Fundamentals?

AGP's (TSE:9377) stock is up by a considerable 31% over the past three months. Given the company's impressive performance, we decided to study its financial indicators more closely as a company's financial health over the long-term usually dictates market outcomes. In this article, we decided to focus on AGP's ROE.
ROE or return on equity is a useful tool to assess how effectively a company can generate returns on the investment it received from its shareholders. In short, ROE shows the profit each dollar generates with respect to its shareholder investments.
See our latest analysis for AGP
How To Calculate Return On Equity?
ROE can be calculated by using the formula:
Return on Equity = Net Profit (from continuing operations) ÷ Shareholders' Equity
So, based on the above formula, the ROE for AGP is:
9.2% = JP¥854m ÷ JP¥9.3b (Based on the trailing twelve months to September 2024).
The 'return' is the amount earned after tax over the last twelve months. One way to conceptualize this is that for each ¥1 of shareholders' capital it has, the company made ¥0.09 in profit.
What Has ROE Got To Do With Earnings Growth?
So far, we've learned that ROE is a measure of a company's profitability. Depending on how much of these profits the company reinvests or "retains", and how effectively it does so, we are then able to assess a company’s earnings growth potential. Assuming all else is equal, companies that have both a higher return on equity and higher profit retention are usually the ones that have a higher growth rate when compared to companies that don't have the same features.
A Side By Side comparison of AGP's Earnings Growth And 9.2% ROE
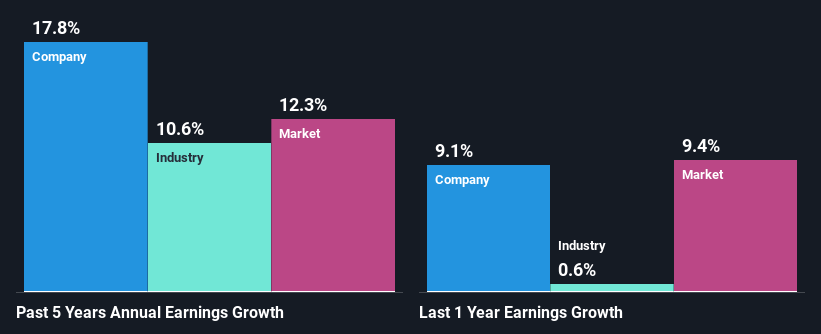
To start with, AGP's ROE looks acceptable. Further, the company's ROE compares quite favorably to the industry average of 5.6%. Probably as a result of this, AGP was able to see a decent growth of 18% over the last five years.
Next, on comparing with the industry net income growth, we found that AGP's growth is quite high when compared to the industry average growth of 11% in the same period, which is great to see.
Earnings growth is a huge factor in stock valuation. What investors need to determine next is if the expected earnings growth, or the lack of it, is already built into the share price. Doing so will help them establish if the stock's future looks promising or ominous. If you're wondering about AGP's's valuation, check out this gauge of its price-to-earnings ratio, as compared to its industry.
Is AGP Using Its Retained Earnings Effectively?
The high three-year median payout ratio of 68% (or a retention ratio of 32%) for AGP suggests that the company's growth wasn't really hampered despite it returning most of its income to its shareholders.
Besides, AGP has been paying dividends for at least ten years or more. This shows that the company is committed to sharing profits with its shareholders.
Summary
In total, we are pretty happy with AGP's performance. We are particularly impressed by the considerable earnings growth posted by the company, which was likely backed by its high ROE. While the company is paying out most of its earnings as dividends, it has been able to grow its earnings in spite of it, so that's probably a good sign. So far, we've only made a quick discussion around the company's earnings growth. To gain further insights into AGP's past profit growth, check out this visualization of past earnings, revenue and cash flows.
New: Manage All Your Stock Portfolios in One Place
We've created the ultimate portfolio companion for stock investors, and it's free.
• Connect an unlimited number of Portfolios and see your total in one currency
• Be alerted to new Warning Signs or Risks via email or mobile
• Track the Fair Value of your stocks
Have feedback on this article? Concerned about the content? Get in touch with us directly. Alternatively, email editorial-team (at) simplywallst.com.
This article by Simply Wall St is general in nature. We provide commentary based on historical data and analyst forecasts only using an unbiased methodology and our articles are not intended to be financial advice. It does not constitute a recommendation to buy or sell any stock, and does not take account of your objectives, or your financial situation. We aim to bring you long-term focused analysis driven by fundamental data. Note that our analysis may not factor in the latest price-sensitive company announcements or qualitative material. Simply Wall St has no position in any stocks mentioned.
About TSE:9377
Excellent balance sheet with proven track record.
Market Insights


Advertisement
Community Narratives
The Future of Drug Testing? Fingerprint Tech Shows Serious Promise
Fair Value US$2.98|40.3% undervalued
JO
Community Contributor
Suncorp’s Next Chapter: Insurance-Only and Ready to Grow
Fair Value AU$22.83|7.9% undervalued
RO
Community Contributor
Thyssenkrupp Nucera Will Achieve Double-Digit Profits by 2030 Boosted by Hydrogen Growth
Fair Value €14.40|31.6% undervalued
CH
Community Contributor
Tesla’s Nvidia Moment – The AI & Robotics Inflection Point
Fair Value US$359.72|12.3% undervalued
BL
Community Contributor