
Advertisement
- Japan
- /
- Infrastructure
- /
- TSE:9353
Market Cool On Sakurajima Futo Kaisha, Ltd.'s (TSE:9353) Earnings Pushing Shares 31% Lower
Sakurajima Futo Kaisha, Ltd. (TSE:9353) shareholders that were waiting for something to happen have been dealt a blow with a 31% share price drop in the last month. Instead of being rewarded, shareholders who have already held through the last twelve months are now sitting on a 41% share price drop.
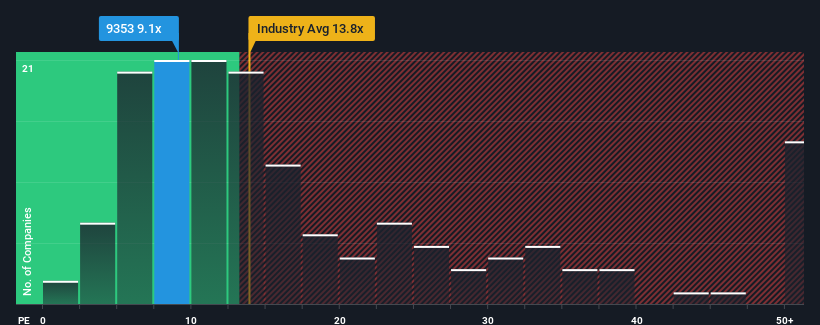
Even after such a large drop in price, Sakurajima Futo Kaisha's price-to-earnings (or "P/E") ratio of 9.1x might still make it look like a buy right now compared to the market in Japan, where around half of the companies have P/E ratios above 14x and even P/E's above 21x are quite common. Although, it's not wise to just take the P/E at face value as there may be an explanation why it's limited.
For instance, Sakurajima Futo Kaisha's receding earnings in recent times would have to be some food for thought. It might be that many expect the disappointing earnings performance to continue or accelerate, which has repressed the P/E. If you like the company, you'd be hoping this isn't the case so that you could potentially pick up some stock while it's out of favour.
See our latest analysis for Sakurajima Futo Kaisha
What Are Growth Metrics Telling Us About The Low P/E?
The only time you'd be truly comfortable seeing a P/E as low as Sakurajima Futo Kaisha's is when the company's growth is on track to lag the market.
If we review the last year of earnings, dishearteningly the company's profits fell to the tune of 13%. Even so, admirably EPS has lifted 80% in aggregate from three years ago, notwithstanding the last 12 months. Accordingly, while they would have preferred to keep the run going, shareholders would probably welcome the medium-term rates of earnings growth.
This is in contrast to the rest of the market, which is expected to grow by 9.8% over the next year, materially lower than the company's recent medium-term annualised growth rates.
In light of this, it's peculiar that Sakurajima Futo Kaisha's P/E sits below the majority of other companies. It looks like most investors are not convinced the company can maintain its recent growth rates.
The Bottom Line On Sakurajima Futo Kaisha's P/E
Sakurajima Futo Kaisha's recently weak share price has pulled its P/E below most other companies. Generally, our preference is to limit the use of the price-to-earnings ratio to establishing what the market thinks about the overall health of a company.
Our examination of Sakurajima Futo Kaisha revealed its three-year earnings trends aren't contributing to its P/E anywhere near as much as we would have predicted, given they look better than current market expectations. There could be some major unobserved threats to earnings preventing the P/E ratio from matching this positive performance. At least price risks look to be very low if recent medium-term earnings trends continue, but investors seem to think future earnings could see a lot of volatility.
You need to take note of risks, for example - Sakurajima Futo Kaisha has 4 warning signs (and 1 which makes us a bit uncomfortable) we think you should know about.
If these risks are making you reconsider your opinion on Sakurajima Futo Kaisha, explore our interactive list of high quality stocks to get an idea of what else is out there.
New: Manage All Your Stock Portfolios in One Place
We've created the ultimate portfolio companion for stock investors, and it's free.
• Connect an unlimited number of Portfolios and see your total in one currency
• Be alerted to new Warning Signs or Risks via email or mobile
• Track the Fair Value of your stocks
Have feedback on this article? Concerned about the content? Get in touch with us directly. Alternatively, email editorial-team (at) simplywallst.com.
This article by Simply Wall St is general in nature. We provide commentary based on historical data and analyst forecasts only using an unbiased methodology and our articles are not intended to be financial advice. It does not constitute a recommendation to buy or sell any stock, and does not take account of your objectives, or your financial situation. We aim to bring you long-term focused analysis driven by fundamental data. Note that our analysis may not factor in the latest price-sensitive company announcements or qualitative material. Simply Wall St has no position in any stocks mentioned.
Have feedback on this article? Concerned about the content? Get in touch with us directly. Alternatively, email editorial-team@simplywallst.com
About TSE:9353
Sakurajima Futo Kaisha
Engages in the port transportation business in Japan.
Solid track record with adequate balance sheet.
Market Insights

Advertisement
Community Narratives

BMW cruising ahead with new EVs and premium models to boost revenue 5%
Fair Value €135.07|44.5% undervalued
UN
Community Contributor
EU#2 - From Humble Beginnings to Global Powerhouse
Fair Value DKK 851.04|46.1% undervalued
TO
Community Contributor