Japan Airlines (TSE:9201) investors are sitting on a loss of 24% if they invested five years ago


In order to justify the effort of selecting individual stocks, it's worth striving to beat the returns from a market index fund. But every investor is virtually certain to have both over-performing and under-performing stocks. At this point some shareholders may be questioning their investment in Japan Airlines Co., Ltd. (TSE:9201), since the last five years saw the share price fall 28%.
With that in mind, it's worth seeing if the company's underlying fundamentals have been the driver of long term performance, or if there are some discrepancies.
Check out our latest analysis for Japan Airlines
To paraphrase Benjamin Graham: Over the short term the market is a voting machine, but over the long term it's a weighing machine. One imperfect but simple way to consider how the market perception of a company has shifted is to compare the change in the earnings per share (EPS) with the share price movement.
During five years of share price growth, Japan Airlines moved from a loss to profitability. That would generally be considered a positive, so we are surprised to see the share price is down. Other metrics may better explain the share price move.
Revenue is actually up 6.9% over the time period. A more detailed examination of the revenue and earnings may or may not explain why the share price languishes; there could be an opportunity.
The graphic below depicts how earnings and revenue have changed over time (unveil the exact values by clicking on the image).
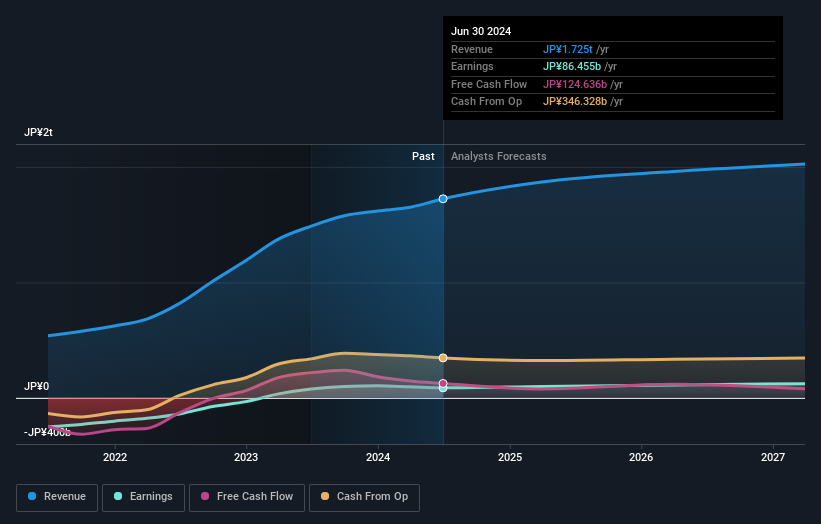
Japan Airlines is well known by investors, and plenty of clever analysts have tried to predict the future profit levels. You can see what analysts are predicting for Japan Airlines in this interactive graph of future profit estimates.
What About Dividends?
When looking at investment returns, it is important to consider the difference between total shareholder return (TSR) and share price return. Whereas the share price return only reflects the change in the share price, the TSR includes the value of dividends (assuming they were reinvested) and the benefit of any discounted capital raising or spin-off. Arguably, the TSR gives a more comprehensive picture of the return generated by a stock. We note that for Japan Airlines the TSR over the last 5 years was -24%, which is better than the share price return mentioned above. The dividends paid by the company have thusly boosted the total shareholder return.
A Different Perspective
Japan Airlines shareholders are down 9.5% for the year (even including dividends), but the market itself is up 18%. Even the share prices of good stocks drop sometimes, but we want to see improvements in the fundamental metrics of a business, before getting too interested. Regrettably, last year's performance caps off a bad run, with the shareholders facing a total loss of 4% per year over five years. We realise that Baron Rothschild has said investors should "buy when there is blood on the streets", but we caution that investors should first be sure they are buying a high quality business. It's always interesting to track share price performance over the longer term. But to understand Japan Airlines better, we need to consider many other factors. To that end, you should be aware of the 1 warning sign we've spotted with Japan Airlines .
If you are like me, then you will not want to miss this free list of undervalued small caps that insiders are buying.
Please note, the market returns quoted in this article reflect the market weighted average returns of stocks that currently trade on Japanese exchanges.
New: Manage All Your Stock Portfolios in One Place
We've created the ultimate portfolio companion for stock investors, and it's free.
• Connect an unlimited number of Portfolios and see your total in one currency
• Be alerted to new Warning Signs or Risks via email or mobile
• Track the Fair Value of your stocks
Have feedback on this article? Concerned about the content? Get in touch with us directly. Alternatively, email editorial-team (at) simplywallst.com.
This article by Simply Wall St is general in nature. We provide commentary based on historical data and analyst forecasts only using an unbiased methodology and our articles are not intended to be financial advice. It does not constitute a recommendation to buy or sell any stock, and does not take account of your objectives, or your financial situation. We aim to bring you long-term focused analysis driven by fundamental data. Note that our analysis may not factor in the latest price-sensitive company announcements or qualitative material. Simply Wall St has no position in any stocks mentioned.
About TSE:9201
Japan Airlines
Provides scheduled and non-scheduled air transport services in Japan, Asia, Oceania, North America, the Unietd Kingdom, and Europe.
Excellent balance sheet second-rate dividend payer.
Similar Companies
Market Insights

Community Narratives
