Advertisement
Japan Airlines (TSE:9201): How Does the Valuation Stack Up After Recent Share Price Pullback?

Simply Wall St
Reviewed by Simply Wall St
Japan Airlines (TSE:9201) shares have drifted lower over the past month, slipping around 5%. With little in the way of headline catalysts recently, investors are taking a closer look at how the airline’s valuation stacks up in the current market.
See our latest analysis for Japan Airlines.
Japan Airlines’ share price has cooled off lately, but the bigger story is its solid long-term run. While the stock is down about 5% over the past month, it is still up a notable 21% for shareholders over the past year and has more than doubled their money across five years. This suggests persistent confidence in its prospects despite recent turbulence.
If you’re curious what else is moving in the market, now is a great time to broaden your search and discover fast growing stocks with high insider ownership
With shares pulling back, the question now is whether Japan Airlines is trading at an attractive valuation or if the stock’s strong long-term gains mean the market has already priced in all the upside.
Price-to-Earnings of 10.4x: Is it justified?
Japan Airlines currently trades at a price-to-earnings (P/E) ratio of 10.4x, which is notably lower than its peer average. At the last close of ¥2,864, this suggests that the market is valuing its earnings at a discount to competitors and the wider sector.
The P/E ratio measures how much investors are willing to pay for a company’s earnings and is a widely used valuation tool in the airline industry. For Japan Airlines, this multiple signals the market may be underestimating its profit potential or taking a cautious view on future growth.
Compared to the Asian Airlines industry (P/E 10.6x) and the peer group average (P/E 14x), Japan Airlines looks attractively valued. Regression analysis also points to a fair price-to-earnings ratio of 16.9x, indicating further headroom if market sentiment shifts. These comparisons highlight a scenario where investors could be getting earnings at a relative bargain, should growth persist.
Explore the SWS fair ratio for Japan Airlines
Result: Price-to-Earnings of 10.4x (UNDERVALUED)
However, slower revenue and net income growth could weigh on sentiment if market expectations shift. Investors should keep an eye on upcoming performance trends.
Find out about the key risks to this Japan Airlines narrative.
Another View: Our DCF Model Suggests Overvaluation
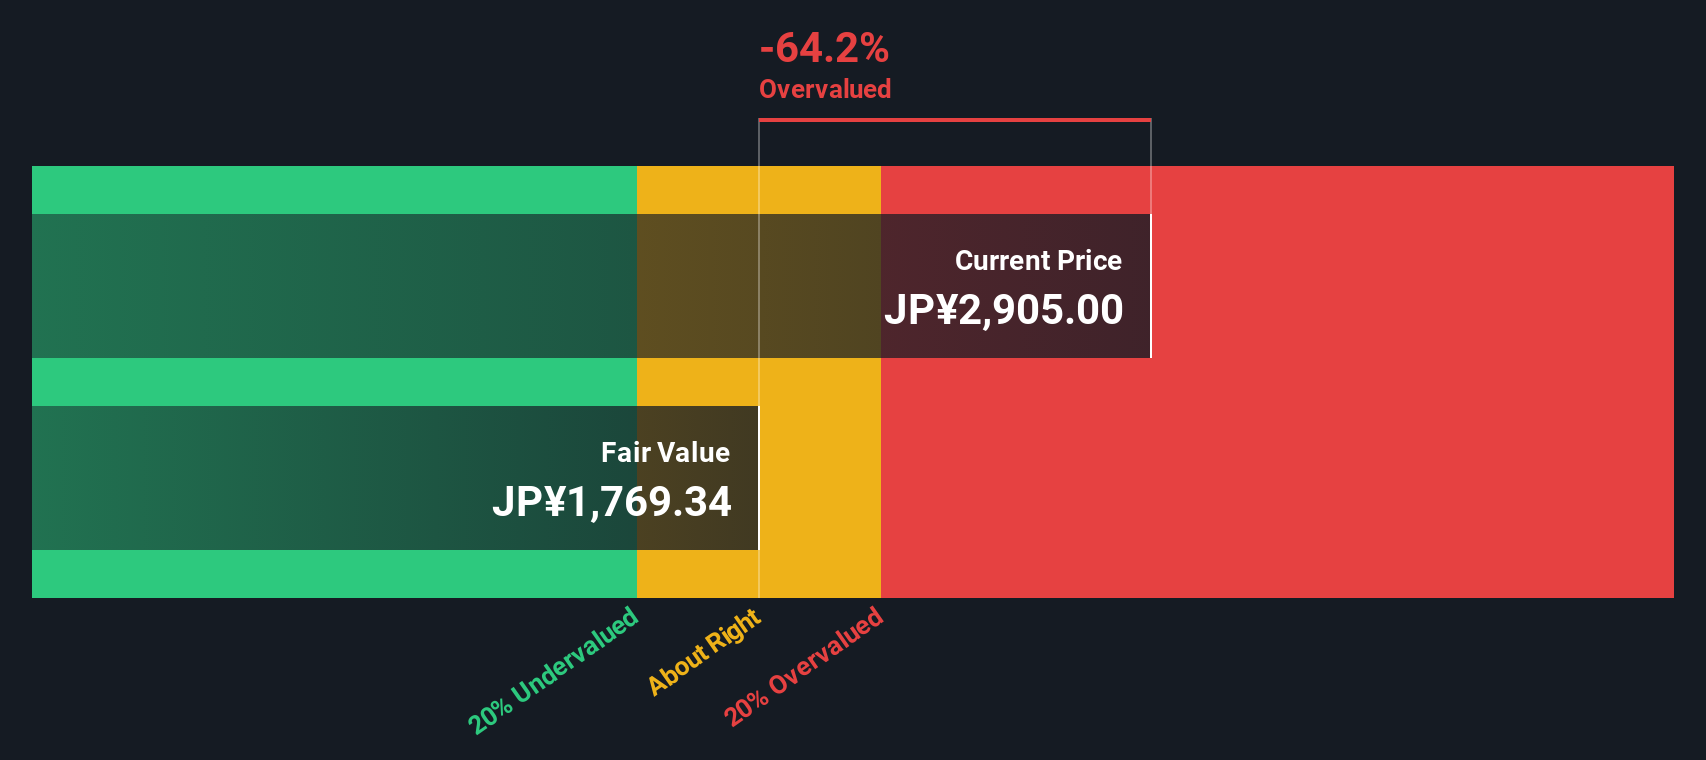
Looking from another angle, the SWS DCF model points to a different conclusion. Based on its forecasted cash flows, Japan Airlines’ shares appear overvalued and are trading well above an estimated fair value of ¥1,769.52. This contrast raises a key question: which outlook will ultimately prove more accurate, the market’s earnings discount or its underlying cash flows?
Look into how the SWS DCF model arrives at its fair value.
Simply Wall St performs a discounted cash flow (DCF) on every stock in the world every day (check out Japan Airlines for example). We show the entire calculation in full. You can track the result in your watchlist or portfolio and be alerted when this changes, or use our stock screener to discover 853 undervalued stocks based on their cash flows. If you save a screener we even alert you when new companies match - so you never miss a potential opportunity.
Build Your Own Japan Airlines Narrative
If you see things differently or want to delve into the numbers yourself, it’s easy to shape your own perspective in just a few minutes, so Do it your way
A great starting point for your Japan Airlines research is our analysis highlighting 5 key rewards and 1 important warning sign that could impact your investment decision.
Looking for More Smart Investment Moves?
Smart investors don’t just focus on one stock or sector. Why not see where else your money could work harder? The Simply Wall Street Screener offers plenty of opportunities just waiting for you to find them.
- Boost your portfolio’s yield and tap into steady payouts by browsing these 21 dividend stocks with yields > 3% with above-average returns and strong fundamentals.
- Stay ahead of the curve and capitalize on the future of medicine by checking out these 34 healthcare AI stocks shaping healthcare innovation with AI breakthroughs.
- Unlock tomorrow’s winners and spot value opportunities among these 853 undervalued stocks based on cash flows set to outperform based on robust cash flow analysis.
This article by Simply Wall St is general in nature. We provide commentary based on historical data and analyst forecasts only using an unbiased methodology and our articles are not intended to be financial advice. It does not constitute a recommendation to buy or sell any stock, and does not take account of your objectives, or your financial situation. We aim to bring you long-term focused analysis driven by fundamental data. Note that our analysis may not factor in the latest price-sensitive company announcements or qualitative material. Simply Wall St has no position in any stocks mentioned.
New: Manage All Your Stock Portfolios in One Place
We've created the ultimate portfolio companion for stock investors, and it's free.
• Connect an unlimited number of Portfolios and see your total in one currency
• Be alerted to new Warning Signs or Risks via email or mobile
• Track the Fair Value of your stocks
Have feedback on this article? Concerned about the content? Get in touch with us directly. Alternatively, email editorial-team@simplywallst.com
About TSE:9201
Japan Airlines
Provides scheduled and non-scheduled air transport services in Japan, Asia, Oceania, the Americas, and internationally.
Excellent balance sheet and good value.
Similar Companies
Market Insights

Advertisement
Community Narratives
The company that turned a verb into a global necessity and basically runs the modern internet, digital ads, smartphones, maps, and AI.
Fair Value US$300.00|8.5% undervalued
OS
Community Contributor
Flowers Foods Pays A Fair Price For Health
Fair Value US$16.12|24.6% undervalued
NV
Community Contributor
TMX Group will thrive with 33.3% profit margin and enduring market moat
Fair Value CA$49.90|0.1% undervalued
LI
Community Contributor