
Advertisement
- Japan
- /
- Telecom Services and Carriers
- /
- TSE:9432
Nippon Telegraph and Telephone Corporation's (TSE:9432) Intrinsic Value Is Potentially 78% Above Its Share Price

Key Insights
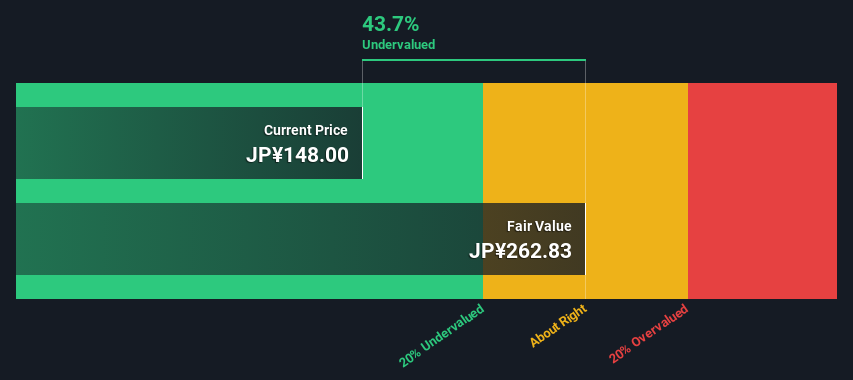
- The projected fair value for Nippon Telegraph and Telephone is JP¥263 based on 2 Stage Free Cash Flow to Equity
- Current share price of JP¥148 suggests Nippon Telegraph and Telephone is potentially 44% undervalued
- Our fair value estimate is 49% higher than Nippon Telegraph and Telephone's analyst price target of JP¥177
In this article we are going to estimate the intrinsic value of Nippon Telegraph and Telephone Corporation (TSE:9432) by taking the forecast future cash flows of the company and discounting them back to today's value. We will use the Discounted Cash Flow (DCF) model on this occasion. It may sound complicated, but actually it is quite simple!
Companies can be valued in a lot of ways, so we would point out that a DCF is not perfect for every situation. If you want to learn more about discounted cash flow, the rationale behind this calculation can be read in detail in the Simply Wall St analysis model.
See our latest analysis for Nippon Telegraph and Telephone
Is Nippon Telegraph and Telephone Fairly Valued?
We're using the 2-stage growth model, which simply means we take in account two stages of company's growth. In the initial period the company may have a higher growth rate and the second stage is usually assumed to have a stable growth rate. To start off with, we need to estimate the next ten years of cash flows. Where possible we use analyst estimates, but when these aren't available we extrapolate the previous free cash flow (FCF) from the last estimate or reported value. We assume companies with shrinking free cash flow will slow their rate of shrinkage, and that companies with growing free cash flow will see their growth rate slow, over this period. We do this to reflect that growth tends to slow more in the early years than it does in later years.
A DCF is all about the idea that a dollar in the future is less valuable than a dollar today, and so the sum of these future cash flows is then discounted to today's value:
10-year free cash flow (FCF) forecast
| 2025 | 2026 | 2027 | 2028 | 2029 | 2030 | 2031 | 2032 | 2033 | 2034 | |
| Levered FCF (¥, Millions) | JP¥639.9b | JP¥554.9b | JP¥766.1b | JP¥717.5b | JP¥792.0b | JP¥843.0b | JP¥881.6b | JP¥910.6b | JP¥932.3b | JP¥948.6b |
| Growth Rate Estimate Source | Analyst x6 | Analyst x6 | Analyst x6 | Analyst x2 | Analyst x1 | Est @ 6.44% | Est @ 4.59% | Est @ 3.29% | Est @ 2.38% | Est @ 1.74% |
| Present Value (¥, Millions) Discounted @ 4.2% | JP¥613.8k | JP¥510.6k | JP¥676.3k | JP¥607.6k | JP¥643.4k | JP¥656.9k | JP¥659.1k | JP¥653.0k | JP¥641.3k | JP¥626.0k |
("Est" = FCF growth rate estimated by Simply Wall St)
Present Value of 10-year Cash Flow (PVCF) = JP¥6.3t
We now need to calculate the Terminal Value, which accounts for all the future cash flows after this ten year period. For a number of reasons a very conservative growth rate is used that cannot exceed that of a country's GDP growth. In this case we have used the 5-year average of the 10-year government bond yield (0.3%) to estimate future growth. In the same way as with the 10-year 'growth' period, we discount future cash flows to today's value, using a cost of equity of 4.2%.
Terminal Value (TV)= FCF2034 × (1 + g) ÷ (r – g) = JP¥949b× (1 + 0.3%) ÷ (4.2%– 0.3%) = JP¥24t
Present Value of Terminal Value (PVTV)= TV / (1 + r)10= JP¥24t÷ ( 1 + 4.2%)10= JP¥16t
The total value, or equity value, is then the sum of the present value of the future cash flows, which in this case is JP¥22t. In the final step we divide the equity value by the number of shares outstanding. Compared to the current share price of JP¥148, the company appears quite undervalued at a 44% discount to where the stock price trades currently. The assumptions in any calculation have a big impact on the valuation, so it is better to view this as a rough estimate, not precise down to the last cent.
The Assumptions
Now the most important inputs to a discounted cash flow are the discount rate, and of course, the actual cash flows. You don't have to agree with these inputs, I recommend redoing the calculations yourself and playing with them. The DCF also does not consider the possible cyclicality of an industry, or a company's future capital requirements, so it does not give a full picture of a company's potential performance. Given that we are looking at Nippon Telegraph and Telephone as potential shareholders, the cost of equity is used as the discount rate, rather than the cost of capital (or weighted average cost of capital, WACC) which accounts for debt. In this calculation we've used 4.2%, which is based on a levered beta of 0.800. Beta is a measure of a stock's volatility, compared to the market as a whole. We get our beta from the industry average beta of globally comparable companies, with an imposed limit between 0.8 and 2.0, which is a reasonable range for a stable business.
SWOT Analysis for Nippon Telegraph and Telephone
Strength
- Debt is well covered by earnings and cashflows.
Weakness
- Earnings declined over the past year.
- Dividend is low compared to the top 25% of dividend payers in the Telecom market.
Opportunity
- Annual earnings are forecast to grow for the next 3 years.
- Good value based on P/E ratio and estimated fair value.
Threat
- Dividends are not covered by cash flow.
- Annual earnings are forecast to grow slower than the Japanese market.
Moving On:
Although the valuation of a company is important, it ideally won't be the sole piece of analysis you scrutinize for a company. The DCF model is not a perfect stock valuation tool. Rather it should be seen as a guide to "what assumptions need to be true for this stock to be under/overvalued?" If a company grows at a different rate, or if its cost of equity or risk free rate changes sharply, the output can look very different. Can we work out why the company is trading at a discount to intrinsic value? For Nippon Telegraph and Telephone, we've compiled three important items you should further research:
- Risks: For example, we've discovered 2 warning signs for Nippon Telegraph and Telephone that you should be aware of before investing here.
- Future Earnings: How does 9432's growth rate compare to its peers and the wider market? Dig deeper into the analyst consensus number for the upcoming years by interacting with our free analyst growth expectation chart.
- Other Solid Businesses: Low debt, high returns on equity and good past performance are fundamental to a strong business. Why not explore our interactive list of stocks with solid business fundamentals to see if there are other companies you may not have considered!
PS. The Simply Wall St app conducts a discounted cash flow valuation for every stock on the TSE every day. If you want to find the calculation for other stocks just search here.
Valuation is complex, but we're here to simplify it.
Discover if Nippon Telegraph and Telephone might be undervalued or overvalued with our detailed analysis, featuring fair value estimates, potential risks, dividends, insider trades, and its financial condition.
Access Free AnalysisHave feedback on this article? Concerned about the content? Get in touch with us directly. Alternatively, email editorial-team (at) simplywallst.com.
This article by Simply Wall St is general in nature. We provide commentary based on historical data and analyst forecasts only using an unbiased methodology and our articles are not intended to be financial advice. It does not constitute a recommendation to buy or sell any stock, and does not take account of your objectives, or your financial situation. We aim to bring you long-term focused analysis driven by fundamental data. Note that our analysis may not factor in the latest price-sensitive company announcements or qualitative material. Simply Wall St has no position in any stocks mentioned.
About TSE:9432
Nippon Telegraph and Telephone
Operates as a telecommunications company in Japan and internationally.
Undervalued average dividend payer.
Similar Companies
Market Insights

Advertisement
Community Narratives
Pinterest will surge as advertising innovations ignite revenue growth
Fair Value US$42.63|27.0% undervalued
BR
Community Contributor
Brambles' Revenue Set to Climb 14% with Profit Margins Following
Fair Value AU$21.90|5.9% overvalued
RO
Community Contributor
Challenging Future for STG as Organic Sales Decline by 8.8%
Fair Value DKK 116.13|26.8% undervalued
KA
Community Contributor