Advertisement
- Japan
- /
- Tech Hardware
- /
- TSE:7751
Is Canon Still Attractive After Recent 12% Pullback and New Healthcare Partnerships in 2025?

Simply Wall St
Reviewed by Simply Wall St
If you are eyeing Canon stock and wondering whether now is the moment to buy, you are in good company. Plenty of investors are debating the same thing, especially after watching shares climb nearly 200% over the last five years. Sure, Canon has dipped a bit lately, down 12.0% year to date, but the story is more complex than a simple rise or fall. Even with modest gains of 0.2% over the last week and 3.0% this month, there is a sense that Canon could be at a turning point, with changing market dynamics putting the company back on many investors’ radars.
What is driving this attention? Part of it is the long-term optimism about Canon’s role in imaging, printing, and its increasing push into industrial and healthcare tech. But a big part is about whether the current price really reflects the company’s value, or if the market has missed something. Right now, Canon scores a 2 out of 6 on our value check, meaning it screens as undervalued on two key valuation signals but is close to fairly valued on others. That is enough to beg the question: Are we looking at a bargain, or just a stock that is priced about right?
Next, we will unpack how those valuation checks break things down, and which approaches matter the most for deciding whether Canon deserves a spot in your portfolio. And stay tuned, because the best way to gauge value might be the one most investors overlook.
Canon scores just 2/6 on our valuation checks. See what other red flags we found in the full valuation breakdown.Approach 1: Canon Discounted Cash Flow (DCF) Analysis
A Discounted Cash Flow (DCF) model estimates a company's intrinsic value by projecting its future cash flows and then discounting them back to today’s value to account for time and risk. For Canon, this approach centers on core operating cash flow, making it a key valuation method.
Canon’s latest reported Free Cash Flow sits at ¥283.8 billion, representing strong ongoing generation. Analyst estimates forecast an increase to approximately ¥366.0 billion by 2029, with the next five years guided by direct forecasts and years beyond that extrapolated for a full DCF projection.
This model calculates a fair value of ¥6,445 per share using a two-stage free cash flow to equity approach. When compared to the current market price, the analysis suggests Canon is trading at a 31.2% discount to its estimated worth. In other words, the shares could be significantly undervalued according to this scenario.
Result: UNDERVALUED
Head to the Valuation section of our Company Report for more details on how we arrive at this Fair Value for Canon.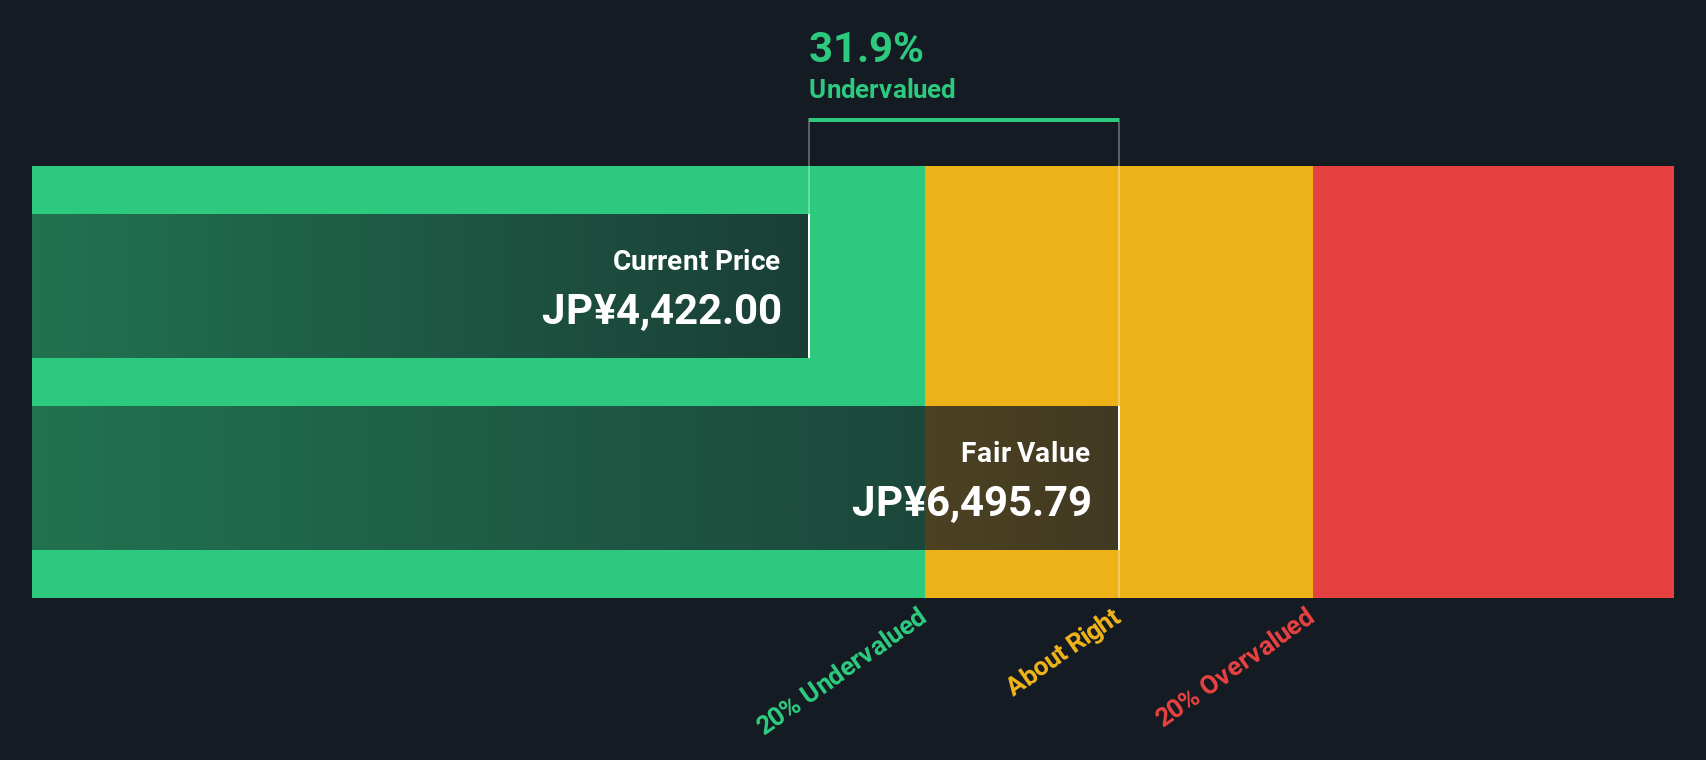
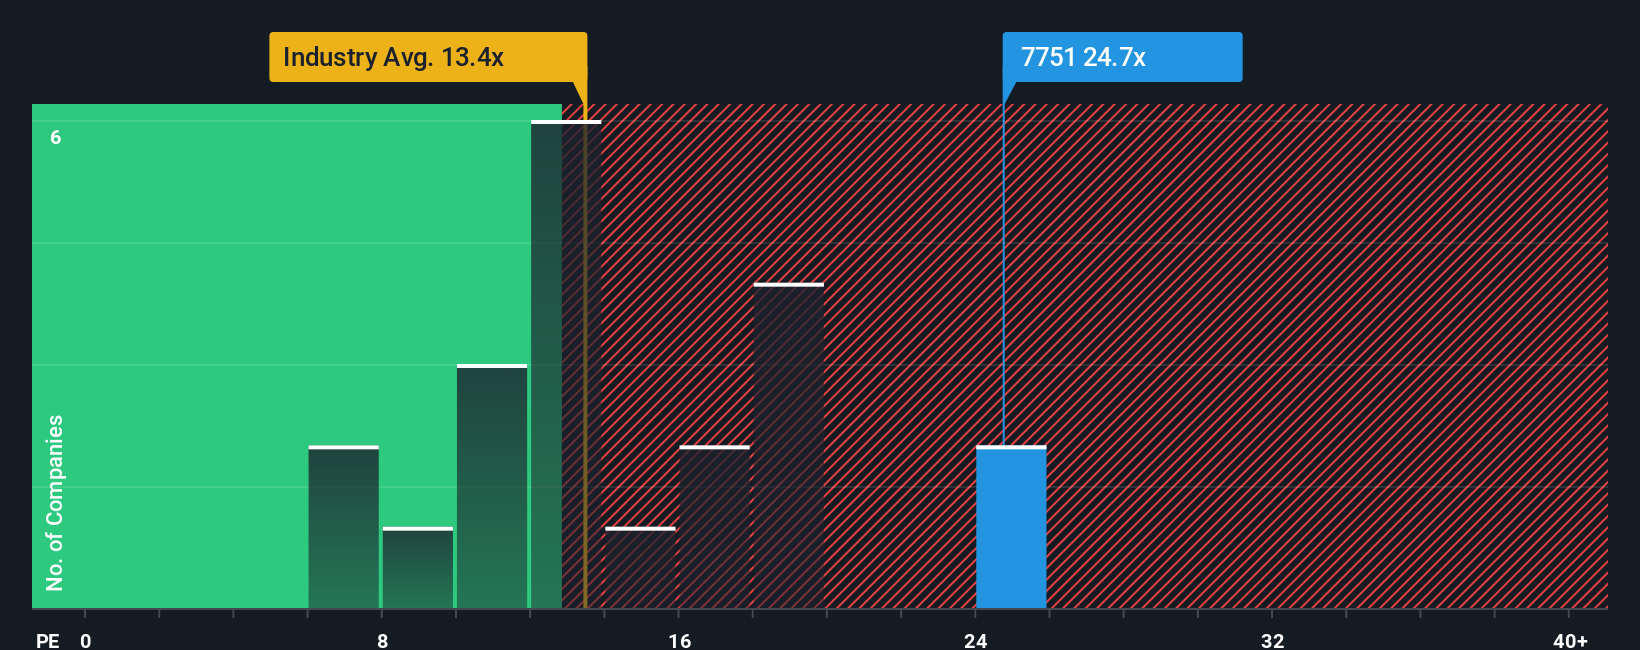
Approach 2: Canon Price vs Earnings (PE)
For profitable companies like Canon, the Price-to-Earnings (PE) ratio is a widely used metric to gauge valuation. It allows investors to quickly compare how much they are paying for each unit of current earnings, making it a go-to benchmark for established, income-generating businesses.
A "normal" or fair PE ratio is not just driven by the company’s current profits. Expectations for growth, perceived risk, profitability, and market dynamics all play a role in setting what is considered fair. Companies with higher future growth or lower risk tend to trade at higher PE multiples, while slower growers or riskier firms usually have lower ratios.
Canon’s current PE stands at 23.45x. That is noticeably above the Tech industry average of 15.01x and peers at 15.42x, indicating the market assigns a premium to Canon versus its sector. However, Simply Wall St’s proprietary Fair Ratio for Canon is 22.17x. This figure is calibrated for the company’s unique blend of growth prospects, earnings quality, profit margins, industry dynamics, and market cap. This Fair Ratio is more insightful than industry or peer comparisons because it adjusts for factors specific to Canon, rather than using a broad-brush approach.
Comparing the current PE of 23.45x to the Fair Ratio of 22.17x shows that Canon’s valuation is quite close to fair value using this lens. The difference is small enough that the stock looks basically priced about right.
Result: ABOUT RIGHT
Upgrade Your Decision Making: Choose your Canon Narrative
Earlier we mentioned that there is an even better way to understand valuation, so let’s introduce you to Narratives. A Narrative is your chance to tell the story behind the numbers. It connects your personal view about Canon’s future with specific financial forecasts, then links it all to a calculated fair value for the stock.
This approach is more powerful than numbers alone, because Narratives make it easy to ground your investment decisions in both your perspective and changing realities. On Simply Wall St’s platform, Narratives are built right into the Community page and are used by millions of investors to clearly map out what they believe will happen next for a company like Canon.
Narratives help you decide when to buy or sell by showing exactly how your fair value compares to the latest share price, and because they update whenever key news or earnings arrive, you are always working with a fresh view.
For example, some investors might see Canon’s fair value well above the current price based on strong growth expectations, while others see a much lower value if they expect earnings to be flat. That is the power of Narratives in action.
Do you think there's more to the story for Canon? Create your own Narrative to let the Community know!
This article by Simply Wall St is general in nature. We provide commentary based on historical data and analyst forecasts only using an unbiased methodology and our articles are not intended to be financial advice. It does not constitute a recommendation to buy or sell any stock, and does not take account of your objectives, or your financial situation. We aim to bring you long-term focused analysis driven by fundamental data. Note that our analysis may not factor in the latest price-sensitive company announcements or qualitative material. Simply Wall St has no position in any stocks mentioned.
New: AI Stock Screener & Alerts
Our new AI Stock Screener scans the market every day to uncover opportunities.
• Dividend Powerhouses (3%+ Yield)
• Undervalued Small Caps with Insider Buying
• High growth Tech and AI Companies
Or build your own from over 50 metrics.
Have feedback on this article? Concerned about the content? Get in touch with us directly. Alternatively, email editorial-team@simplywallst.com
About TSE:7751
Canon
Manufactures and sells office multifunction devices (MFDs), laser and inkjet printers, cameras, medical equipment, and lithography equipment in Japan, the Americas, Europe, and Asia and Oceania.
Excellent balance sheet with low risk.
Similar Companies
Market Insights

Advertisement
Community Narratives
MINISO's fair value is projected at 26.69 with an anticipated PE ratio shift of 20x
Fair Value US$24.03|11.0% undervalued
BE
Community Contributor
Procter & Gamble: A Dividend Giant Facing Slowing Growth
Fair Value US$119.81|23.3% overvalued
AN
Community Contributor
Eli Lilly's Future Growth Driven by Tirzepatide and Favorable Market Conditions
Fair Value US$1.19k|13.8% undervalued
EA
Community Contributor