Advertisement
- Japan
- /
- Electronic Equipment and Components
- /
- TSE:6861
What Do Recent Keyence Losses Mean for Investors in 2025?

Simply Wall St
Reviewed by Simply Wall St
If you follow Japanese automation stocks, you've probably noticed Keyence’s share price has had a rough ride lately. At its last close of 56,060 yen, the stock is down just slightly over the past week and month, but when you zoom out, things look a bit tougher. It's dipped 11.3% since the start of the year and is down 18.2% over the last twelve months. Despite these headwinds, Keyence is still up nearly 20% across five years. This makes the recent declines stand out all the more for long-term investors.
Some of this short-term weakness reflects shifting market sentiment toward industrial technology companies, as well as broader debates about the pace of automation investment. There’s also chatter about how global economic uncertainty could impact capital spending. These factors have put a bit of a brake on stocks like Keyence. Still, while volatility has returned, it’s worth noting how the company continues to post impressive multi-year gains amid these swings.
With all of this in mind, it’s natural to wonder whether the recent price action has carved out a buying opportunity or if there are deeper challenges lurking beneath the surface. According to a composite valuation score, a tool designed to check a company’s price tag against key fundamentals, Keyence is currently undervalued in just one out of six key measures. That’s a score of 1, suggesting there might not be major value hiding here by traditional standards.
But before making any snap judgments, let’s take a closer look at how Keyence stacks up across several valuation checks. After that, I’ll share an even more powerful way to think about what the company’s price really means today.
Keyence scores just 1/6 on our valuation checks. See what other red flags we found in the full valuation breakdown.Approach 1: Keyence Discounted Cash Flow (DCF) Analysis
The Discounted Cash Flow (DCF) model estimates the intrinsic value of a company by projecting its future free cash flows and then discounting them back to today's value. This approach helps investors gauge whether a stock is trading above or below its true worth.
For Keyence, the DCF model uses current Free Cash Flow, which stands at ¥386.3 billion, as the base. Analysts have forecast that annual free cash flow could climb to approximately ¥507.5 billion by the fiscal year ending March 2030. It is worth highlighting that analyst estimates generally cover the first five years, and projections beyond 2028 are extrapolated from existing trends. All values are reported in Japanese yen, matching both the listing and reporting currency.
This method arrives at a DCF-based intrinsic value of ¥35,715 per share. Compared to the current market price of ¥56,060, the DCF analysis suggests Keyence is trading at a premium. Specifically, the stock appears to be about 57% overvalued by this measure, indicating the market is pricing in significant expectations for growth beyond what the model projects.
Result: OVERVALUED
Head to the Valuation section of our Company Report for more details on how we arrive at this Fair Value for Keyence.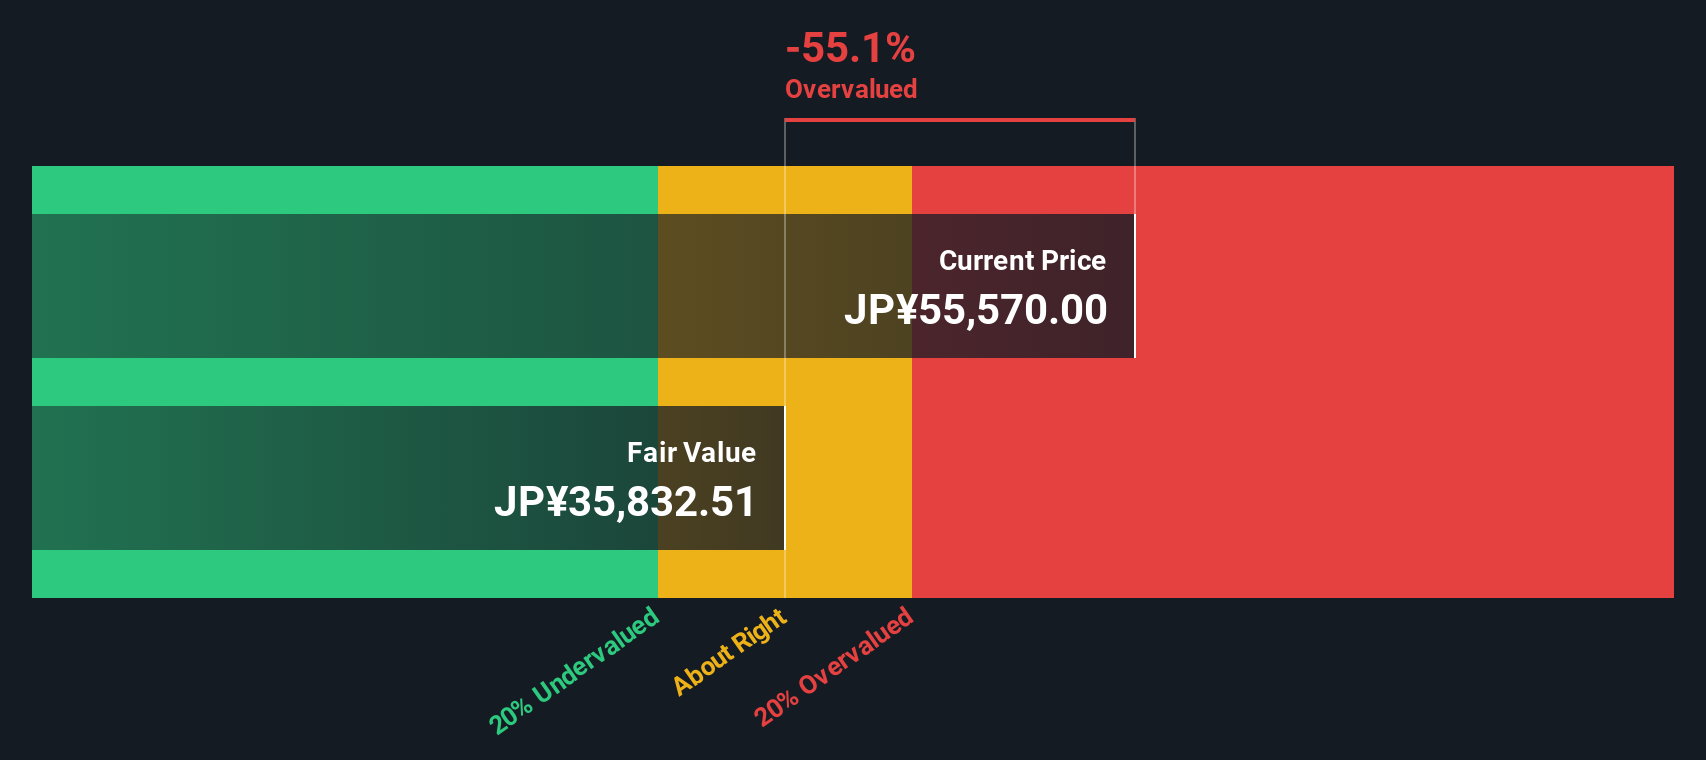
Approach 2: Keyence Price vs Earnings
The price-to-earnings (PE) ratio is often the go-to valuation metric for established, profitable companies like Keyence. Since it relates a company's share price to its earnings per share, the PE ratio gives investors a sense of how much the market is willing to pay for each unit of current profit. For businesses with steady earnings and growth, it is a particularly useful yardstick.
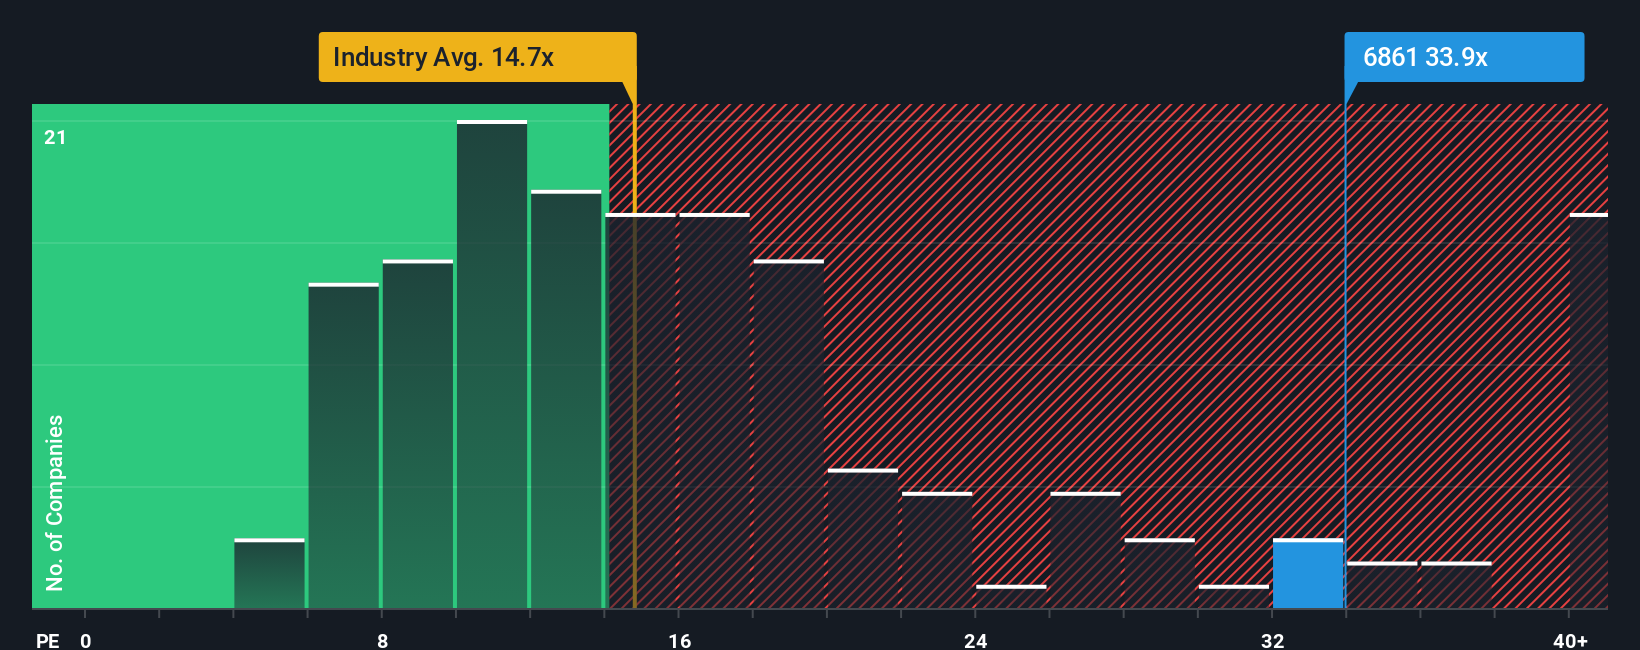
What counts as a “fair” PE ratio depends largely on expectations for future earnings growth and the perceived risks to those earnings. Higher growth companies tend to command higher PE multiples, while increased risk can suppress the multiple that investors are willing to pay. For context, Keyence currently trades at a PE ratio of 34.2x, which is considerably higher than the average for its industry, at 14.7x, and the peer group average of 18.2x.
While industry and peer comparisons are informative, Simply Wall St's proprietary “Fair Ratio” digs deeper by factoring in Keyence’s unique characteristics, including its expected growth, profit margins, business risks, industry trends, and overall market cap. This tailored approach puts Keyence’s Fair Ratio at 22.8x. This value bridges the gap between broad benchmarks and the company’s specific fundamentals. Because Keyence’s actual PE of 34.2x is notably above its Fair Ratio, the implication is that the stock is trading at a significant premium to what its fundamentals suggest is justified right now.
Result: OVERVALUED
Upgrade Your Decision Making: Choose your Keyence Narrative
Earlier we mentioned that there is an even better way to understand valuation, so let’s introduce you to Narratives. A Narrative is more than just a number; it is a story-driven approach where you combine your perspective on a company like Keyence with your own estimates for future revenue, profit margins, and fair value. This powerful tool connects your view of Keyence’s business journey with a custom financial forecast, showing you what price you believe is truly fair based on your story.
Narratives are designed to be accessible and intuitive, available to everyone on Simply Wall St's Community page, where millions of investors share and refine their outlooks. By building a Narrative, you can easily compare your Fair Value estimate to the current market price and decide if now is the right time to buy or sell. Because real-world information is always changing, Narratives update automatically whenever new data or major news is released, keeping your valuation relevant.
To illustrate, one Narrative for Keyence forecasts a much higher fair value based on rapid automation demand; another is more cautious and values it lower given global economic risks. Narratives let you see a range of investor viewpoints, instantly bridging the gap between a company’s story, the numbers, and your decisions.
Do you think there's more to the story for Keyence? Create your own Narrative to let the Community know!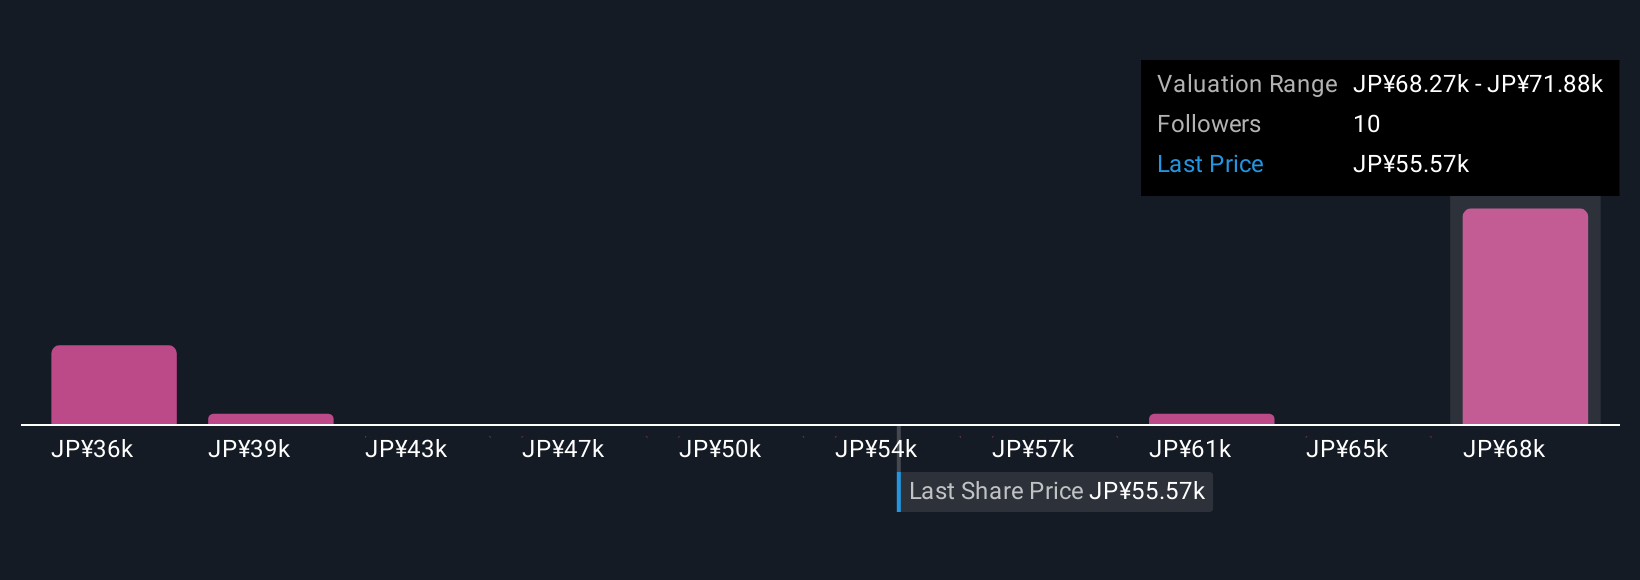
This article by Simply Wall St is general in nature. We provide commentary based on historical data and analyst forecasts only using an unbiased methodology and our articles are not intended to be financial advice. It does not constitute a recommendation to buy or sell any stock, and does not take account of your objectives, or your financial situation. We aim to bring you long-term focused analysis driven by fundamental data. Note that our analysis may not factor in the latest price-sensitive company announcements or qualitative material. Simply Wall St has no position in any stocks mentioned.
Valuation is complex, but we're here to simplify it.
Discover if Keyence might be undervalued or overvalued with our detailed analysis, featuring fair value estimates, potential risks, dividends, insider trades, and its financial condition.
Access Free AnalysisHave feedback on this article? Concerned about the content? Get in touch with us directly. Alternatively, email editorial-team@simplywallst.com
About TSE:6861
Flawless balance sheet with proven track record.
Similar Companies
Market Insights

Advertisement
Community Narratives
MINISO's fair value is projected at 26.69 with an anticipated PE ratio shift of 20x
Fair Value US$24.03|9.0% undervalued
BE
Community Contributor
Procter & Gamble: A Dividend Giant Facing Slowing Growth
Fair Value US$119.81|23.5% overvalued
AN
Community Contributor
Eli Lilly's Future Growth Driven by Tirzepatide and Favorable Market Conditions
Fair Value US$1.19k|14.4% undervalued
EA
Community Contributor