Advertisement
- Japan
- /
- Electronic Equipment and Components
- /
- TSE:6856
Evaluating HORIBA After Shares Surge 46% and New Technology Partnership in 2025

Simply Wall St
Reviewed by Bailey Pemberton
If you have been watching HORIBA, you might be asking yourself whether now is the right moment to buy in, stay patient, or even take some profits. After all, few companies on the market have shown the kind of returns HORIBA has achieved. Shares are up 5.8% over the past week, an impressive 12.9% in the last month, and a remarkable 46.5% year-to-date. Stretching that time horizon makes the story look even better: in three years, shares have soared 143.2%, and in just five years, the stock is up 183.9%. This is the kind of long-term growth that makes investors sit up and take notice.
There is more at play than just numbers on a chart. Recent momentum for HORIBA has come alongside broader shifts in market sentiment toward technology-driven, globally diversified firms. As investors become more willing to pay for perceived quality and growth, stocks like HORIBA are getting attention not just for past performance but for their future potential as well.
The big question, though, is whether all this excitement is justified by valuation metrics. According to our analysis, HORIBA is undervalued in 4 out of 6 core valuation checks, giving it a value score of 4. This can be a strong signal for those on the hunt for a potential bargain, but numbers do not tell the whole story.
Let us break down the major valuation approaches next. If you are looking for an even more insightful way to understand what HORIBA is really worth, stay tuned for the final section.
Approach 1: HORIBA Discounted Cash Flow (DCF) Analysis
The Discounted Cash Flow (DCF) model estimates HORIBA's true value by projecting its future cash flows and then discounting those amounts back to today's terms. This approach is widely used to capture the intrinsic worth of a business by focusing on how much cash it is expected to generate for shareholders in the years ahead.
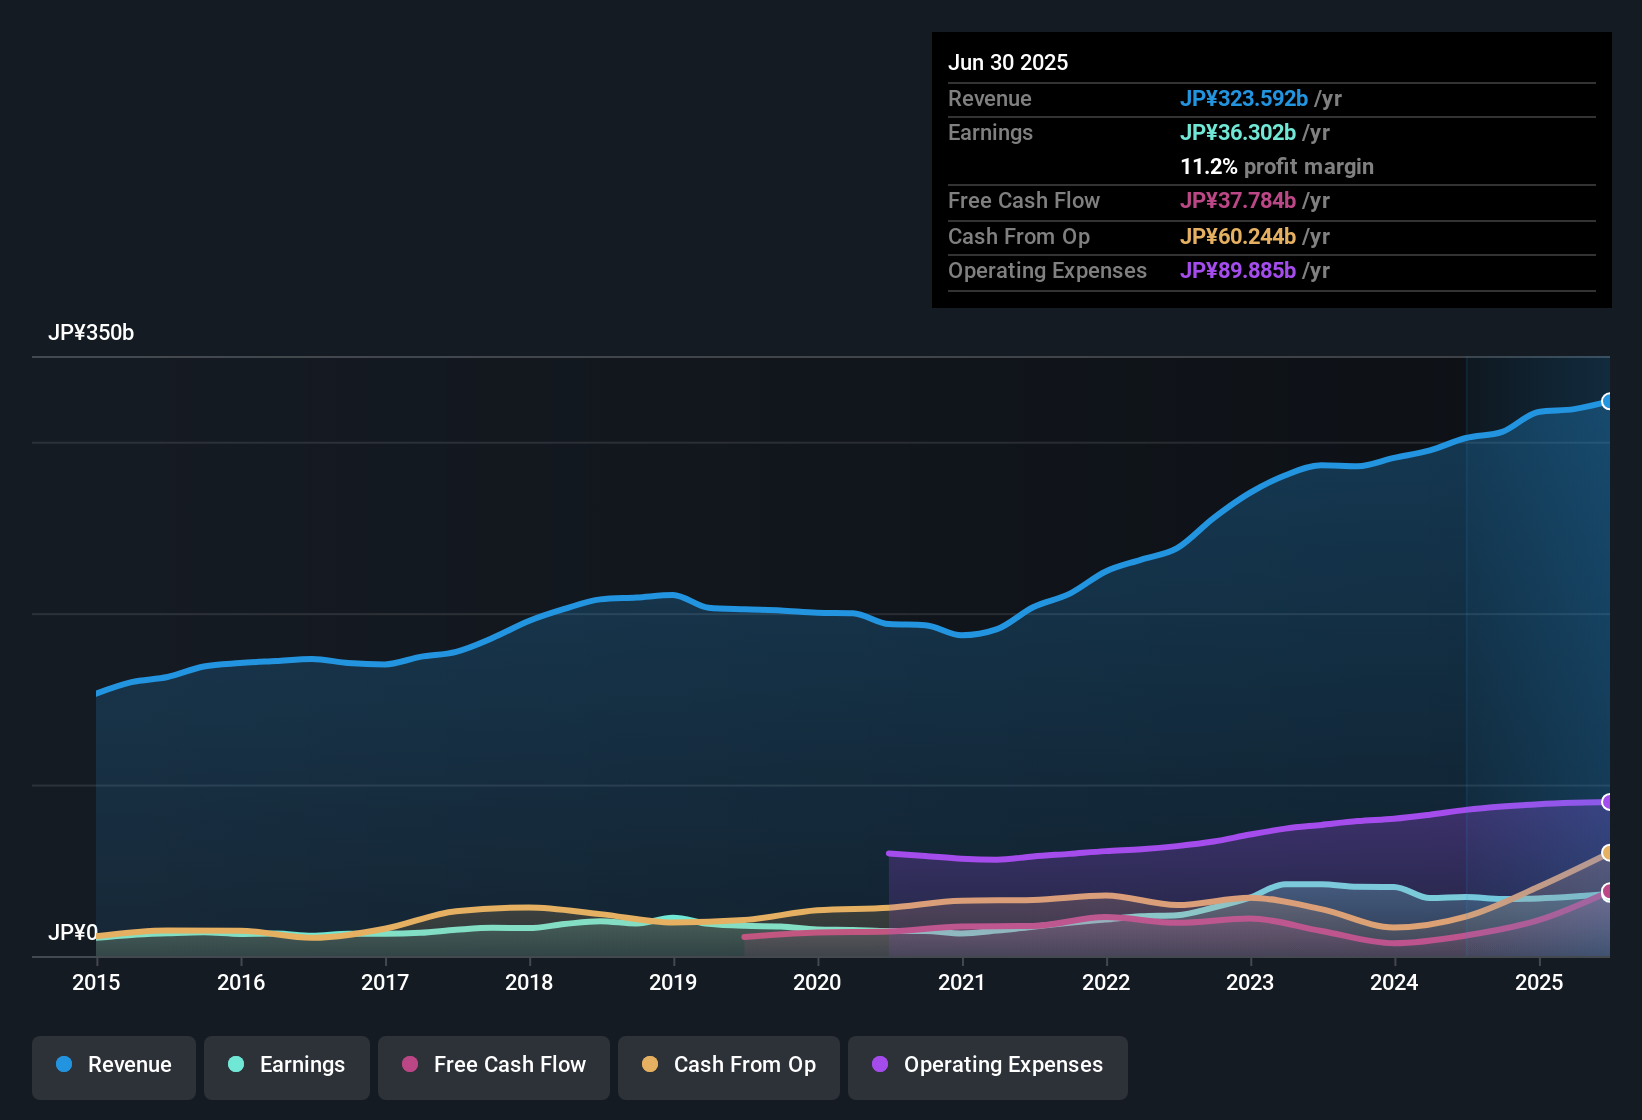
Currently, HORIBA’s Free Cash Flow (FCF) sits at ¥43.85 billion. According to analysts, annual FCF is forecast to grow to ¥48.22 billion by 2029. Further out, projections estimate figures close to ¥50.19 billion by 2035. Simply Wall St extrapolates beyond traditional analyst forecasts to provide a longer-term outlook. These projections form the basis for the company’s valuation today.
By running these numbers through a 2 Stage Free Cash Flow to Equity model, the estimated intrinsic value for HORIBA comes out to ¥18,051 per share. At today’s prices, this suggests the stock is trading at a 26.2% discount to its fair value. This result implies notable undervaluation.
Result: UNDERVALUED
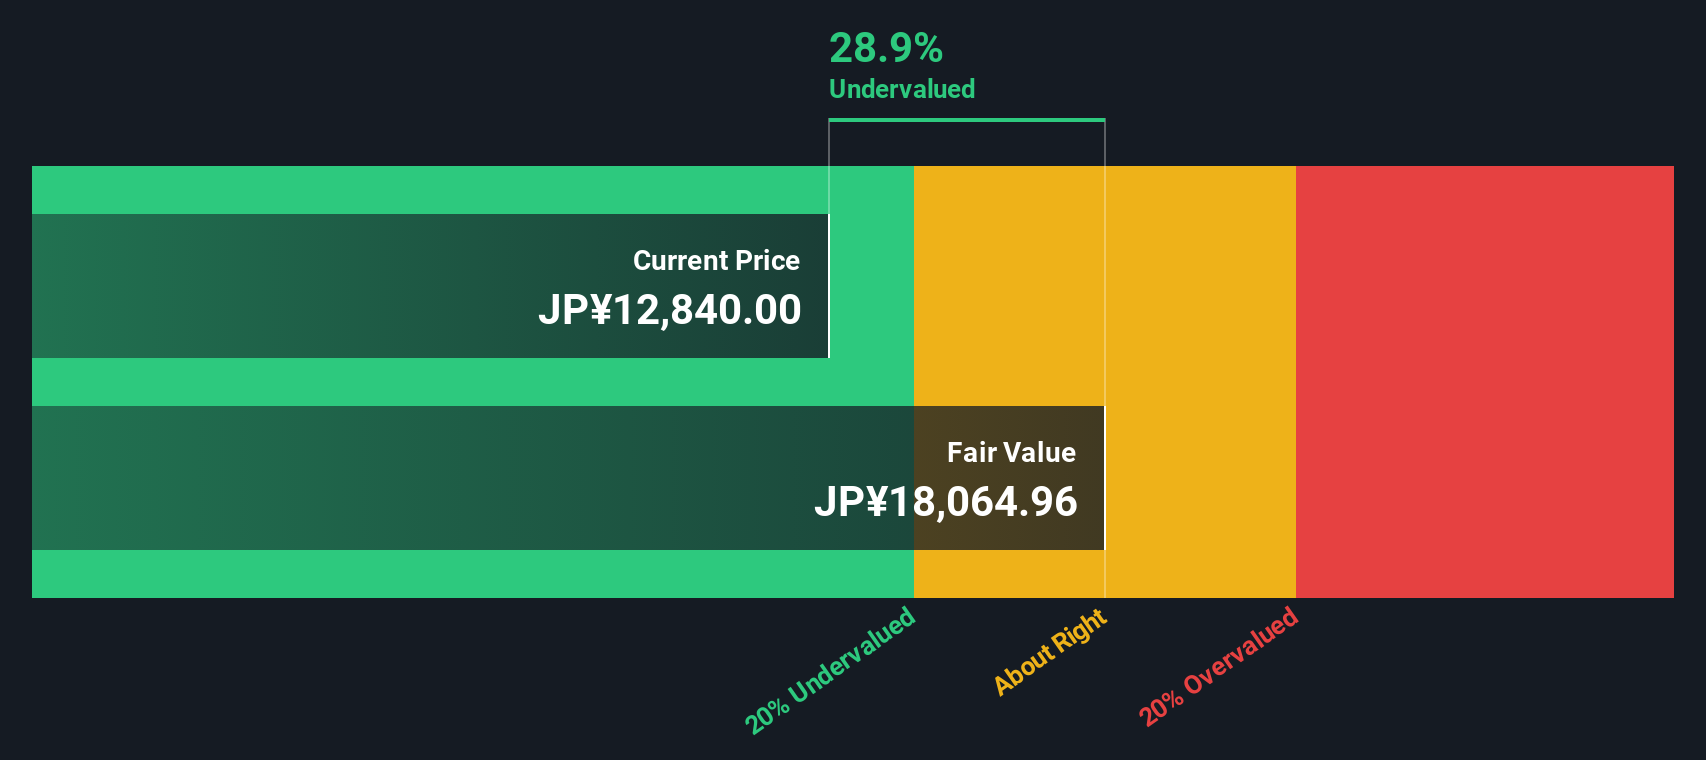
Our Discounted Cash Flow (DCF) analysis suggests HORIBA is undervalued by 26.2%. Track this in your watchlist or portfolio, or discover more undervalued stocks.
Approach 2: HORIBA Price vs Earnings
For profitable companies like HORIBA, the price-to-earnings (PE) ratio is a widely used and suitable metric. It allows investors to quickly compare how much they are paying for each unit of the company's earnings, helping to gauge whether a stock is cheap or expensive relative to its profits.
PE ratios are influenced by growth expectations and risk. A higher PE ratio is generally justified for businesses with strong profit growth prospects or lower risk, while slower-growing or riskier firms tend to trade at lower multiples. It is important not only to look at the raw figure but also to consider what a typical or "fair" PE should be for HORIBA's specific profile.
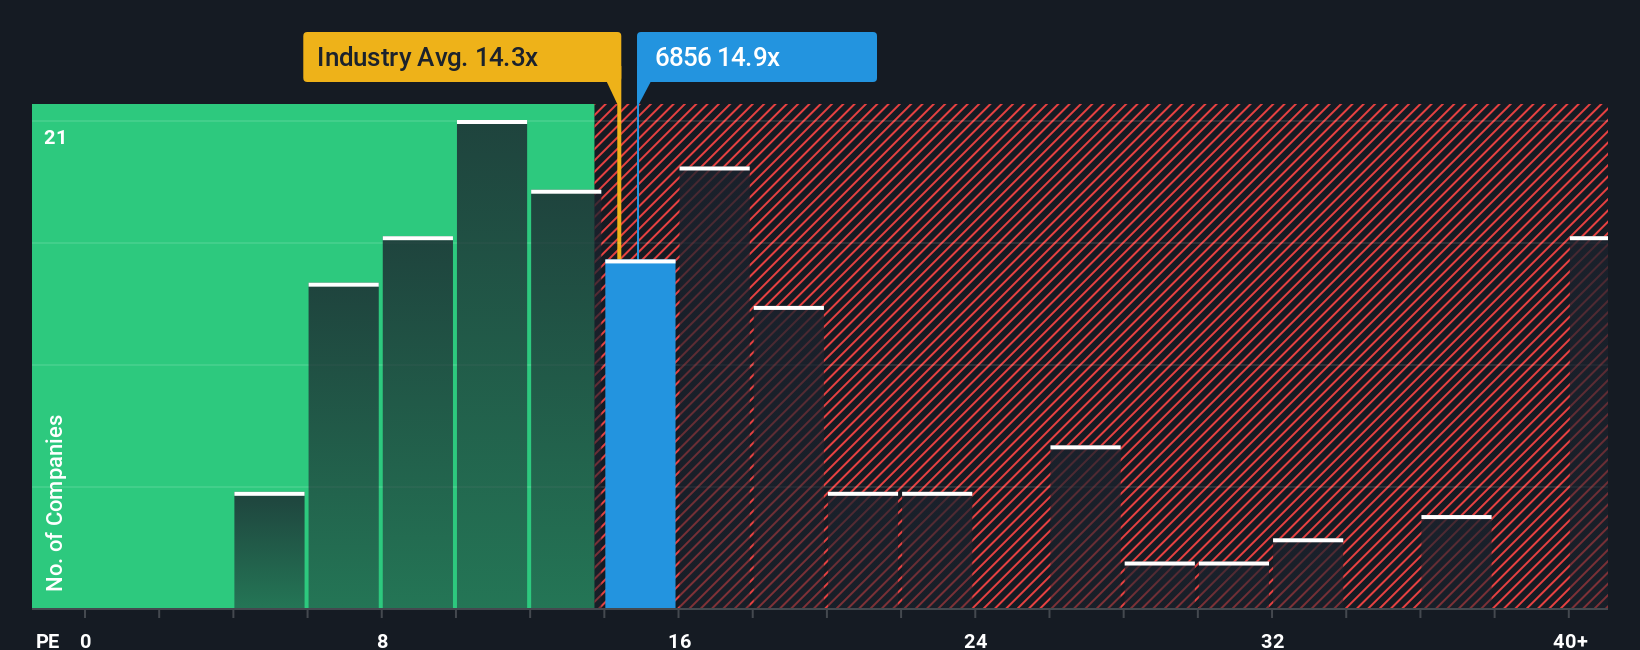
Currently, HORIBA trades at a PE ratio of 15.4x. This is slightly above the average for the Electronic industry, which is 14.4x, but well below the average across its peers at 19.1x. Rather than compare only with peers or the industry, Simply Wall St’s Fair Ratio provides a more tailored benchmark. The Fair Ratio takes into account key elements such as HORIBA’s projected earnings growth, its risk profile, profit margins, its exact industry, and market capitalization. For HORIBA, the Fair Ratio is 17.5x, reflecting the multiple investors might expect to pay given its unique characteristics.
Since HORIBA’s current PE of 15.4x is lower than the Fair Ratio of 17.5x, this suggests that the stock is trading at a discount relative to what would be justified by its fundamentals and growth potential.
Result: UNDERVALUED
PE ratios tell one story, but what if the real opportunity lies elsewhere? Discover companies where insiders are betting big on explosive growth.
Upgrade Your Decision Making: Choose your HORIBA Narrative
Earlier we mentioned that there is an even better way to understand valuation. Let us introduce you to Narratives. A Narrative is your personal investment story, combining your take on a company's future with your own forecasts for revenue, profit, and fair value. With Narratives, you connect the dots from a company’s outlook to the numbers, and then to what you believe the business is really worth. This approach helps you go far beyond generic valuation models.
On Simply Wall St, Narratives are accessible right on the Community page, making it simple for millions of investors to create, compare, and update their perspectives as news or earnings reports come in. By aligning your Narrative’s fair value with the current share price, you gain a dynamic guide for making buy, hold or sell decisions that actually match your beliefs and expectations.
For example, one HORIBA investor’s Narrative might reflect a high fair value based on rapid innovation. Another might see a much lower value due to concerns about global competition. Narratives empower you to invest with conviction using real, evolving forecasts instead of just static ratios.
Do you think there's more to the story for HORIBA? Create your own Narrative to let the Community know!
This article by Simply Wall St is general in nature. We provide commentary based on historical data and analyst forecasts only using an unbiased methodology and our articles are not intended to be financial advice. It does not constitute a recommendation to buy or sell any stock, and does not take account of your objectives, or your financial situation. We aim to bring you long-term focused analysis driven by fundamental data. Note that our analysis may not factor in the latest price-sensitive company announcements or qualitative material. Simply Wall St has no position in any stocks mentioned.
Valuation is complex, but we're here to simplify it.
Discover if HORIBA might be undervalued or overvalued with our detailed analysis, featuring fair value estimates, potential risks, dividends, insider trades, and its financial condition.
Access Free AnalysisHave feedback on this article? Concerned about the content? Get in touch with us directly. Alternatively, email editorial-team@simplywallst.com
About TSE:6856
Flawless balance sheet, good value and pays a dividend.
Similar Companies
Market Insights

Advertisement
Community Narratives
The Next Phase of Energy Storage: How NeoVolta Is Tackling America’s Power Crunch
Fair Value US$7.50|35.1% undervalued
MA
Community Contributor
Why EnSilica is Worth Possibly 13x its Current Price
Fair Value UK£5.00|89.8% undervalued
DO
Community Contributor
M&A Activity, Industry Diversification & A Defense Contract Monopoly Will Push BWXT For Healthy Long-Term Growth
Fair Value US$220.00|15.2% undervalued
CL
Community Contributor
A case for Cassiar Gold Corp (TSXV: GLDC) to reach CAD$8-10 before 2030 (X30-37)
Fair Value CA$10.00|96.0% undervalued
AG
Community Contributor