- Japan
- /
- Electronic Equipment and Components
- /
- TSE:6775
TB Group Inc.'s (TSE:6775) 40% Dip Still Leaving Some Shareholders Feeling Restless Over Its P/SRatio

TB Group Inc. (TSE:6775) shareholders that were waiting for something to happen have been dealt a blow with a 40% share price drop in the last month. For any long-term shareholders, the last month ends a year to forget by locking in a 64% share price decline.
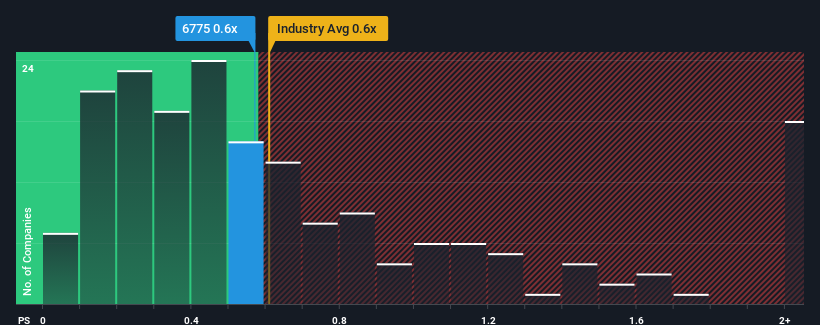
Even after such a large drop in price, you could still be forgiven for feeling indifferent about TB Group's P/S ratio of 0.6x, since the median price-to-sales (or "P/S") ratio for the Electronic industry in Japan is about the same. Although, it's not wise to simply ignore the P/S without explanation as investors may be disregarding a distinct opportunity or a costly mistake.
See our latest analysis for TB Group
What Does TB Group's Recent Performance Look Like?
As an illustration, revenue has deteriorated at TB Group over the last year, which is not ideal at all. One possibility is that the P/S is moderate because investors think the company might still do enough to be in line with the broader industry in the near future. If not, then existing shareholders may be a little nervous about the viability of the share price.
Want the full picture on earnings, revenue and cash flow for the company? Then our free report on TB Group will help you shine a light on its historical performance.What Are Revenue Growth Metrics Telling Us About The P/S?
In order to justify its P/S ratio, TB Group would need to produce growth that's similar to the industry.
In reviewing the last year of financials, we were disheartened to see the company's revenues fell to the tune of 1.8%. This means it has also seen a slide in revenue over the longer-term as revenue is down 6.2% in total over the last three years. Therefore, it's fair to say the revenue growth recently has been undesirable for the company.
In contrast to the company, the rest of the industry is expected to grow by 8.1% over the next year, which really puts the company's recent medium-term revenue decline into perspective.
With this information, we find it concerning that TB Group is trading at a fairly similar P/S compared to the industry. It seems most investors are ignoring the recent poor growth rate and are hoping for a turnaround in the company's business prospects. Only the boldest would assume these prices are sustainable as a continuation of recent revenue trends is likely to weigh on the share price eventually.
What We Can Learn From TB Group's P/S?
With its share price dropping off a cliff, the P/S for TB Group looks to be in line with the rest of the Electronic industry. We'd say the price-to-sales ratio's power isn't primarily as a valuation instrument but rather to gauge current investor sentiment and future expectations.
We find it unexpected that TB Group trades at a P/S ratio that is comparable to the rest of the industry, despite experiencing declining revenues during the medium-term, while the industry as a whole is expected to grow. When we see revenue heading backwards in the context of growing industry forecasts, it'd make sense to expect a possible share price decline on the horizon, sending the moderate P/S lower. Unless the recent medium-term conditions improve markedly, investors will have a hard time accepting the share price as fair value.
Don't forget that there may be other risks. For instance, we've identified 2 warning signs for TB Group that you should be aware of.
It's important to make sure you look for a great company, not just the first idea you come across. So if growing profitability aligns with your idea of a great company, take a peek at this free list of interesting companies with strong recent earnings growth (and a low P/E).
Mobile Infrastructure for Defense and Disaster
The next wave in robotics isn't humanoid. Its fully autonomous towers delivering 5G, ISR, and radar in under 30 minutes, anywhere.
Get the investor briefing before the next round of contracts
Sponsored On Behalf of CiTechValuation is complex, but we're here to simplify it.
Discover if TB Group might be undervalued or overvalued with our detailed analysis, featuring fair value estimates, potential risks, dividends, insider trades, and its financial condition.
Access Free AnalysisHave feedback on this article? Concerned about the content? Get in touch with us directly. Alternatively, email editorial-team (at) simplywallst.com.
This article by Simply Wall St is general in nature. We provide commentary based on historical data and analyst forecasts only using an unbiased methodology and our articles are not intended to be financial advice. It does not constitute a recommendation to buy or sell any stock, and does not take account of your objectives, or your financial situation. We aim to bring you long-term focused analysis driven by fundamental data. Note that our analysis may not factor in the latest price-sensitive company announcements or qualitative material. Simply Wall St has no position in any stocks mentioned.
Have feedback on this article? Concerned about the content? Get in touch with us directly. Alternatively, email editorial-team@simplywallst.com
About TSE:6775
TB Group
Engages in LED lighting and ECO, digital signage, electronic money, and store automation businesses.
Excellent balance sheet and overvalued.
Market Insights

Weekly Picks

Early mover in a fast growing industry. Likely to experience share price volatility as they scale


A case for CA$31.80 (undiluted), aka 8,616% upside from CA$0.37 (an 86 bagger!).


Moderation and Stabilisation: HOLD: Fair Price based on a 4-year Cycle is $12.08
Recently Updated Narratives


An amazing opportunity to potentially get a 100 bagger

Amazon: Why the World’s Biggest Platform Still Runs on Invisible Economics

Sunrun Stock: When the Energy Transition Collides With the Cost of Capital
Popular Narratives


MicroVision will explode future revenue by 380.37% with a vision towards success


Crazy Undervalued 42 Baggers Silver Play (Active & Running Mine)

