- Japan
- /
- Electronic Equipment and Components
- /
- TSE:6775
Optimistic Investors Push TB Group Inc. (TSE:6775) Shares Up 30% But Growth Is Lacking

TB Group Inc. (TSE:6775) shares have had a really impressive month, gaining 30% after a shaky period beforehand. Unfortunately, the gains of the last month did little to right the losses of the last year with the stock still down 28% over that time.
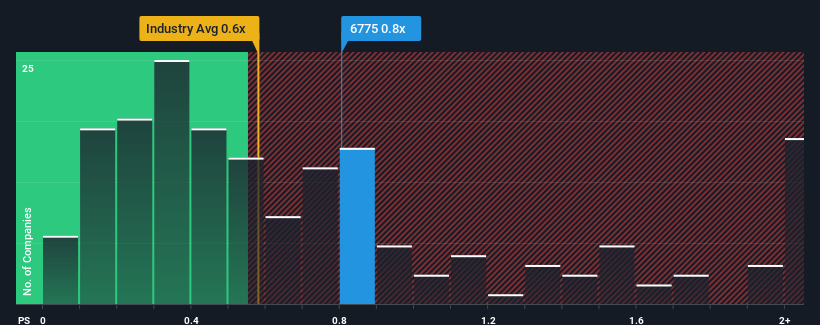
Although its price has surged higher, you could still be forgiven for feeling indifferent about TB Group's P/S ratio of 0.8x, since the median price-to-sales (or "P/S") ratio for the Electronic industry in Japan is also close to 0.6x. However, investors might be overlooking a clear opportunity or potential setback if there is no rational basis for the P/S.
Our free stock report includes 3 warning signs investors should be aware of before investing in TB Group. Read for free now.See our latest analysis for TB Group
What Does TB Group's P/S Mean For Shareholders?
For example, consider that TB Group's financial performance has been poor lately as its revenue has been in decline. One possibility is that the P/S is moderate because investors think the company might still do enough to be in line with the broader industry in the near future. If you like the company, you'd at least be hoping this is the case so that you could potentially pick up some stock while it's not quite in favour.
Although there are no analyst estimates available for TB Group, take a look at this free data-rich visualisation to see how the company stacks up on earnings, revenue and cash flow.What Are Revenue Growth Metrics Telling Us About The P/S?
There's an inherent assumption that a company should be matching the industry for P/S ratios like TB Group's to be considered reasonable.
Retrospectively, the last year delivered a frustrating 5.9% decrease to the company's top line. The last three years don't look nice either as the company has shrunk revenue by 11% in aggregate. Therefore, it's fair to say the revenue growth recently has been undesirable for the company.
Comparing that to the industry, which is predicted to deliver 5.3% growth in the next 12 months, the company's downward momentum based on recent medium-term revenue results is a sobering picture.
With this information, we find it concerning that TB Group is trading at a fairly similar P/S compared to the industry. Apparently many investors in the company are way less bearish than recent times would indicate and aren't willing to let go of their stock right now. There's a good chance existing shareholders are setting themselves up for future disappointment if the P/S falls to levels more in line with the recent negative growth rates.
What Does TB Group's P/S Mean For Investors?
TB Group's stock has a lot of momentum behind it lately, which has brought its P/S level with the rest of the industry. We'd say the price-to-sales ratio's power isn't primarily as a valuation instrument but rather to gauge current investor sentiment and future expectations.
We find it unexpected that TB Group trades at a P/S ratio that is comparable to the rest of the industry, despite experiencing declining revenues during the medium-term, while the industry as a whole is expected to grow. When we see revenue heading backwards in the context of growing industry forecasts, it'd make sense to expect a possible share price decline on the horizon, sending the moderate P/S lower. Unless the recent medium-term conditions improve markedly, investors will have a hard time accepting the share price as fair value.
And what about other risks? Every company has them, and we've spotted 3 warning signs for TB Group (of which 1 is a bit concerning!) you should know about.
If you're unsure about the strength of TB Group's business, why not explore our interactive list of stocks with solid business fundamentals for some other companies you may have missed.
Mobile Infrastructure for Defense and Disaster
The next wave in robotics isn't humanoid. Its fully autonomous towers delivering 5G, ISR, and radar in under 30 minutes, anywhere.
Get the investor briefing before the next round of contracts
Sponsored On Behalf of CiTechValuation is complex, but we're here to simplify it.
Discover if TB Group might be undervalued or overvalued with our detailed analysis, featuring fair value estimates, potential risks, dividends, insider trades, and its financial condition.
Access Free AnalysisHave feedback on this article? Concerned about the content? Get in touch with us directly. Alternatively, email editorial-team (at) simplywallst.com.
This article by Simply Wall St is general in nature. We provide commentary based on historical data and analyst forecasts only using an unbiased methodology and our articles are not intended to be financial advice. It does not constitute a recommendation to buy or sell any stock, and does not take account of your objectives, or your financial situation. We aim to bring you long-term focused analysis driven by fundamental data. Note that our analysis may not factor in the latest price-sensitive company announcements or qualitative material. Simply Wall St has no position in any stocks mentioned.
About TSE:6775
TB Group
Engages in LED lighting and ECO, digital signage, electronic money, and store automation businesses.
Excellent balance sheet and overvalued.
Market Insights

Weekly Picks

Early mover in a fast growing industry. Likely to experience share price volatility as they scale


A case for CA$31.80 (undiluted), aka 8,616% upside from CA$0.37 (an 86 bagger!).


Moderation and Stabilisation: HOLD: Fair Price based on a 4-year Cycle is $12.08
Recently Updated Narratives


Title: Market Sentiment Is Dead Wrong — Here's Why PSEC Deserves a Second Look


An amazing opportunity to potentially get a 100 bagger

Amazon: Why the World’s Biggest Platform Still Runs on Invisible Economics
Popular Narratives


MicroVision will explode future revenue by 380.37% with a vision towards success


Crazy Undervalued 42 Baggers Silver Play (Active & Running Mine)


NVDA: Expanding AI Demand Will Drive Major Data Center Investments Through 2026
Trending Discussion
