Advertisement
- Japan
- /
- Tech Hardware
- /
- TSE:6736
Sun (TSE:6736): Does Today’s Valuation Discount Market Uncertainty or Opportunity?

Simply Wall St
Reviewed by Simply Wall St
If you have been watching Sun (TSE:6736) lately, you are not alone. While there is no single headline-grabbing event moving the stock right now, the steady shifts in its price and the sheer volatility over the past few months have caught the eyes of both cautious and more adventurous investors. A year like this, without a major catalyst, often raises interesting questions: is the market quietly pricing in new information, or is uncertainty holding Sun back?
Zooming out, Sun’s journey over the past year has been anything but smooth. Shares are up just under 1% over the past 12 months, well below its multi-year highs, and the longer-term picture reveals wild swings. Despite a setback earlier this year, momentum has begun rebuilding with a 21% rally in the past 3 months after a tough start. The stock is still down nearly 30% since January, reminding investors that short-term performance can differ sharply from its long-run trajectory, which has delivered nearly triple returns over five years.
Given these mixed signals in momentum and the lack of a clear driving event, the key question now is whether Sun is a bargain waiting to be discovered, or if all the potential is already baked into the current price.
Price-to-Earnings of 8.3x: Is it justified?
Sun is trading at a Price-to-Earnings (P/E) ratio of 8.3x, which is notably lower than both the Japanese market average of 14.7x and the broader tech sector’s average of 14x. This suggests that the market currently values Sun's earnings at a significant discount compared to its peers.
The P/E ratio is a widely used valuation measure that compares a company’s share price to its earnings per share. For the tech sector, which often features higher growth and volatility, a lower P/E can indicate market skepticism about the sustainability of profits or future growth potential. In Sun's case, its below-average P/E stands out in a sector typically associated with higher multiples.
This indicates that investors may be underestimating Sun's future earnings potential, possibly due to its recent volatility or a lack of confidence in the consistency of its profits. Alternatively, the presence of one-off gains might be distorting its earnings base, leading to a lower multiple than might otherwise be justified by its business fundamentals.
Result: Fair Value of ¥1,682.56 (OVERVALUED)
See our latest analysis for Sun.However, continued earnings inconsistency or a sudden shift in sector sentiment could quickly undermine Sun’s value recovery story.
Find out about the key risks to this Sun narrative.Another View: What Does Our DCF Model Reveal?
Taking a different approach, our DCF model comes to an opposing conclusion. While the market puts Sun at a discount due to its low earnings ratio, the DCF calculation suggests the shares might be trading above their fair value. This could point to a lack of confidence in future cash flows, or perhaps the market is missing something that the numbers reveal.
Look into how the SWS DCF model arrives at its fair value.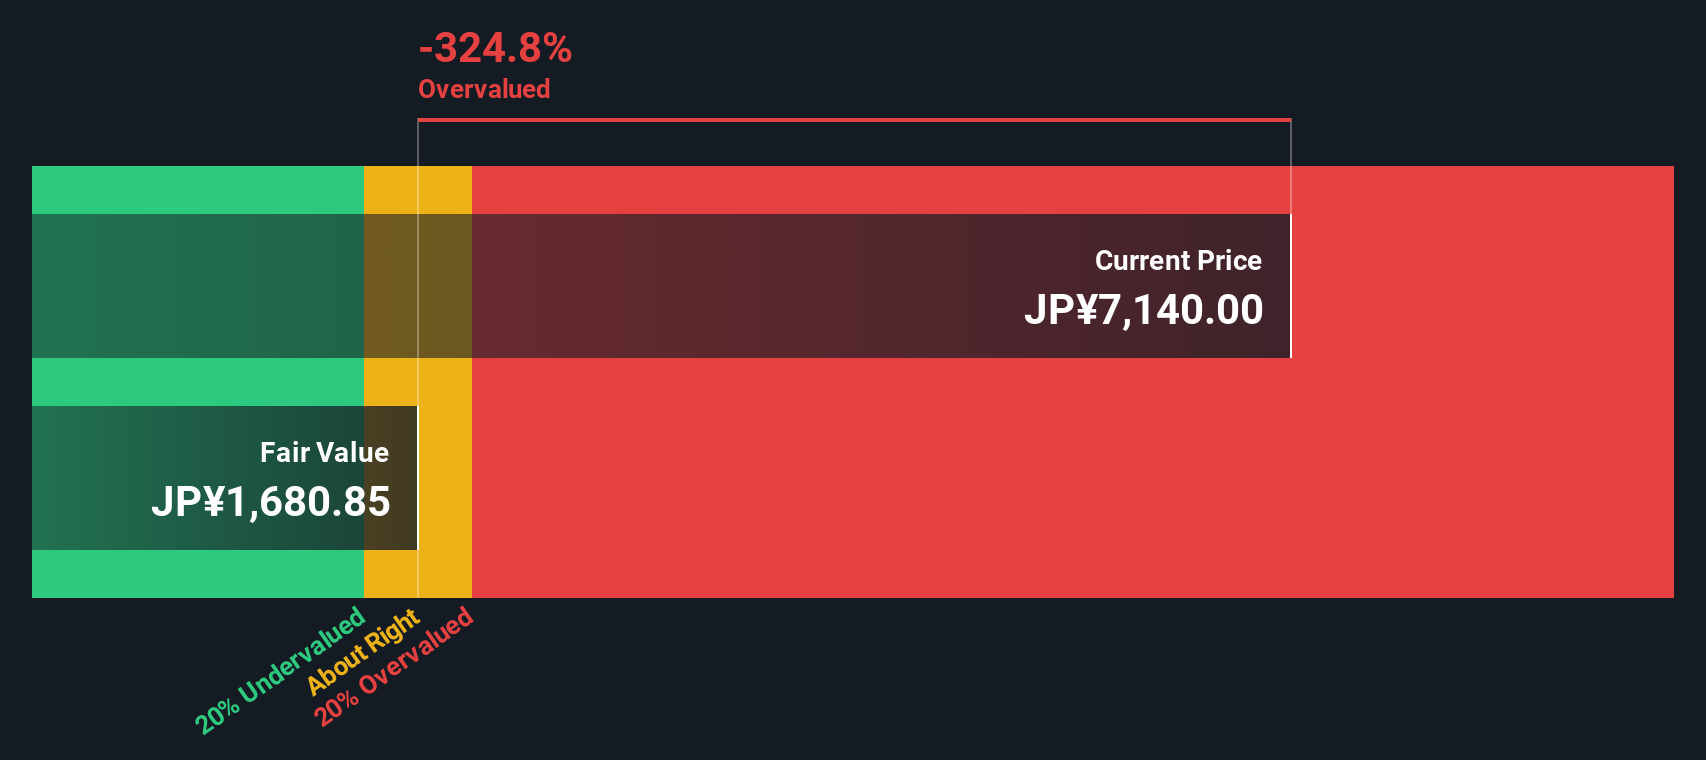
Build Your Own Sun Narrative
If you see Sun's situation differently, or are the type of investor who likes to dig deeper, you can shape your own perspective in just a few minutes. Do it your way.
A great starting point for your Sun research is our analysis highlighting 2 key rewards and 2 important warning signs that could impact your investment decision.
Looking for More Investment Opportunities?
Unlock a world of investment ideas by using the Simply Wall Street Screener. Don’t settle for the obvious when unique opportunities are just a click away. Seize your edge before others do.
- Spot the companies reshaping tomorrow’s medicine and accelerate your strategy with healthcare AI stocks.
- Catch high-yield opportunities with exceptional potential. Pursue dividend stocks with yields > 3% for robust income streams and stability.
- Uncover undervalued gems with strong fundamentals before the crowd by using undervalued stocks based on cash flows.
This article by Simply Wall St is general in nature. We provide commentary based on historical data and analyst forecasts only using an unbiased methodology and our articles are not intended to be financial advice. It does not constitute a recommendation to buy or sell any stock, and does not take account of your objectives, or your financial situation. We aim to bring you long-term focused analysis driven by fundamental data. Note that our analysis may not factor in the latest price-sensitive company announcements or qualitative material. Simply Wall St has no position in any stocks mentioned.
New: Manage All Your Stock Portfolios in One Place
We've created the ultimate portfolio companion for stock investors, and it's free.
• Connect an unlimited number of Portfolios and see your total in one currency
• Be alerted to new Warning Signs or Risks via email or mobile
• Track the Fair Value of your stocks
Have feedback on this article? Concerned about the content? Get in touch with us directly. Alternatively, email editorial-team@simplywallst.com
About TSE:6736
Sun
Engages in the mobile data solutions, entertainment, information technology, and other businesses in Japan.
Excellent balance sheet with acceptable track record.
Market Insights


Advertisement
Community Narratives
100% Patient Improvement in trial puts this $16M Biotech on the radar
Fair Value US$5.30|69.6% undervalued
JO
Community Contributor
Exxon Mobil's 17.5% Upside Promises Industry-Leading Returns in Energy Transition
Fair Value US$132.00|14.8% undervalued
HE
Community Contributor
NHC Analysis: Quality at a Good Price. A Golden Opportunity?
Fair Value US$179.80|36.9% undervalued
DA
Community Contributor
Product Refresh And Global Expansion Will Empower Future Market Leadership
Fair Value US$206.17|20.5% undervalued
AN
Based on Analyst Price Targets