- Japan
- /
- Electronic Equipment and Components
- /
- TSE:6664
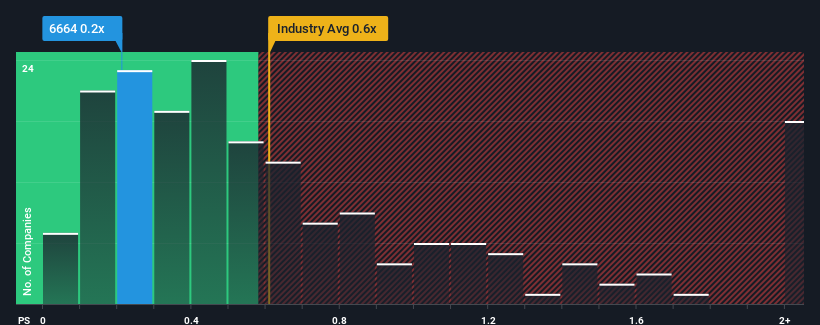
Some Optoelectronics Co.,Ltd. (TSE:6664) Shareholders Look For Exit As Shares Take 31% Pounding

The Optoelectronics Co.,Ltd. (TSE:6664) share price has fared very poorly over the last month, falling by a substantial 31%. Instead of being rewarded, shareholders who have already held through the last twelve months are now sitting on a 39% share price drop.
In spite of the heavy fall in price, you could still be forgiven for feeling indifferent about OptoelectronicsLtd's P/S ratio of 0.2x, since the median price-to-sales (or "P/S") ratio for the Electronic industry in Japan is also close to 0.6x. While this might not raise any eyebrows, if the P/S ratio is not justified investors could be missing out on a potential opportunity or ignoring looming disappointment.
View our latest analysis for OptoelectronicsLtd
How Has OptoelectronicsLtd Performed Recently?
As an illustration, revenue has deteriorated at OptoelectronicsLtd over the last year, which is not ideal at all. It might be that many expect the company to put the disappointing revenue performance behind them over the coming period, which has kept the P/S from falling. If not, then existing shareholders may be a little nervous about the viability of the share price.
Although there are no analyst estimates available for OptoelectronicsLtd, take a look at this free data-rich visualisation to see how the company stacks up on earnings, revenue and cash flow.Do Revenue Forecasts Match The P/S Ratio?
There's an inherent assumption that a company should be matching the industry for P/S ratios like OptoelectronicsLtd's to be considered reasonable.
Retrospectively, the last year delivered a frustrating 7.0% decrease to the company's top line. The last three years don't look nice either as the company has shrunk revenue by 16% in aggregate. Accordingly, shareholders would have felt downbeat about the medium-term rates of revenue growth.
Comparing that to the industry, which is predicted to deliver 8.1% growth in the next 12 months, the company's downward momentum based on recent medium-term revenue results is a sobering picture.
With this in mind, we find it worrying that OptoelectronicsLtd's P/S exceeds that of its industry peers. Apparently many investors in the company are way less bearish than recent times would indicate and aren't willing to let go of their stock right now. There's a good chance existing shareholders are setting themselves up for future disappointment if the P/S falls to levels more in line with the recent negative growth rates.
The Final Word
Following OptoelectronicsLtd's share price tumble, its P/S is just clinging on to the industry median P/S. While the price-to-sales ratio shouldn't be the defining factor in whether you buy a stock or not, it's quite a capable barometer of revenue expectations.
The fact that OptoelectronicsLtd currently trades at a P/S on par with the rest of the industry is surprising to us since its recent revenues have been in decline over the medium-term, all while the industry is set to grow. Even though it matches the industry, we're uncomfortable with the current P/S ratio, as this dismal revenue performance is unlikely to support a more positive sentiment for long. Unless the recent medium-term conditions improve markedly, investors will have a hard time accepting the share price as fair value.
Don't forget that there may be other risks. For instance, we've identified 3 warning signs for OptoelectronicsLtd that you should be aware of.
If you're unsure about the strength of OptoelectronicsLtd's business, why not explore our interactive list of stocks with solid business fundamentals for some other companies you may have missed.
The New Payments ETF Is Live on NASDAQ:
Money is moving to real-time rails, and a newly listed ETF now gives investors direct exposure. Fast settlement. Institutional custody. Simple access.
Explore how this launch could reshape portfolios
Sponsored ContentNew: AI Stock Screener & Alerts
Our new AI Stock Screener scans the market every day to uncover opportunities.
• Dividend Powerhouses (3%+ Yield)
• Undervalued Small Caps with Insider Buying
• High growth Tech and AI Companies
Or build your own from over 50 metrics.
Have feedback on this article? Concerned about the content? Get in touch with us directly. Alternatively, email editorial-team (at) simplywallst.com.
This article by Simply Wall St is general in nature. We provide commentary based on historical data and analyst forecasts only using an unbiased methodology and our articles are not intended to be financial advice. It does not constitute a recommendation to buy or sell any stock, and does not take account of your objectives, or your financial situation. We aim to bring you long-term focused analysis driven by fundamental data. Note that our analysis may not factor in the latest price-sensitive company announcements or qualitative material. Simply Wall St has no position in any stocks mentioned.
Have feedback on this article? Concerned about the content? Get in touch with us directly. Alternatively, email editorial-team@simplywallst.com
About TSE:6664
Optoelectronics
Develops, manufactures, and sells automatic identification devices in Japan, the United States the America, Europe, Asia, and internationally.
Flawless balance sheet with low risk.
Similar Companies
Market Insights

Weekly Picks

Early mover in a fast growing industry. Likely to experience share price volatility as they scale


A case for CA$31.80 (undiluted), aka 8,616% upside from CA$0.37 (an 86 bagger!).


Moderation and Stabilisation: HOLD: Fair Price based on a 4-year Cycle is $12.08
Recently Updated Narratives


Title: Market Sentiment Is Dead Wrong — Here's Why PSEC Deserves a Second Look


An amazing opportunity to potentially get a 100 bagger

Amazon: Why the World’s Biggest Platform Still Runs on Invisible Economics
Popular Narratives


Crazy Undervalued 42 Baggers Silver Play (Active & Running Mine)


MicroVision will explode future revenue by 380.37% with a vision towards success


NVDA: Expanding AI Demand Will Drive Major Data Center Investments Through 2026
Trending Discussion
