
Advertisement
- Japan
- /
- Electronic Equipment and Components
- /
- TSE:6664
Here's Why OptoelectronicsLtd (TYO:6664) Can Afford Some Debt
Howard Marks put it nicely when he said that, rather than worrying about share price volatility, 'The possibility of permanent loss is the risk I worry about... and every practical investor I know worries about.' So it might be obvious that you need to consider debt, when you think about how risky any given stock is, because too much debt can sink a company. Importantly, Optoelectronics Co.,Ltd. (TYO:6664) does carry debt. But the more important question is: how much risk is that debt creating?
Why Does Debt Bring Risk?
Debt assists a business until the business has trouble paying it off, either with new capital or with free cash flow. Part and parcel of capitalism is the process of 'creative destruction' where failed businesses are mercilessly liquidated by their bankers. However, a more frequent (but still costly) occurrence is where a company must issue shares at bargain-basement prices, permanently diluting shareholders, just to shore up its balance sheet. Of course, the upside of debt is that it often represents cheap capital, especially when it replaces dilution in a company with the ability to reinvest at high rates of return. The first step when considering a company's debt levels is to consider its cash and debt together.
View our latest analysis for OptoelectronicsLtd
What Is OptoelectronicsLtd's Debt?
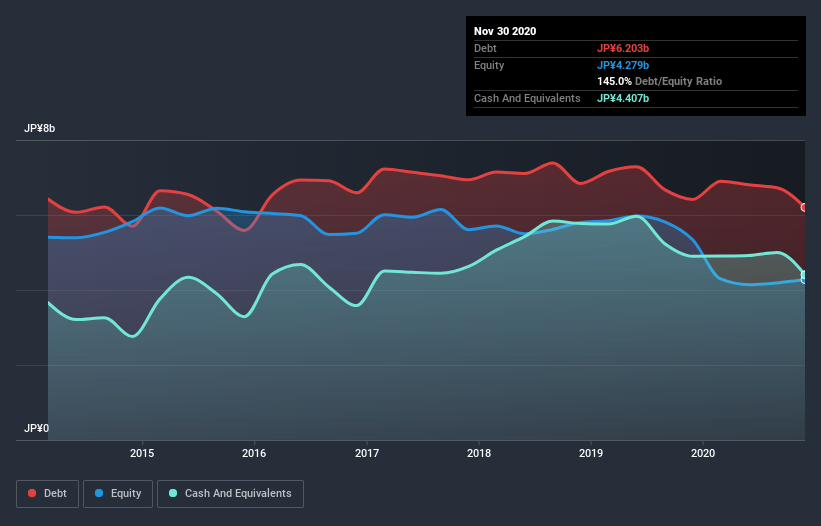
As you can see below, OptoelectronicsLtd had JP¥6.20b of debt, at November 2020, which is about the same as the year before. You can click the chart for greater detail. However, it does have JP¥4.41b in cash offsetting this, leading to net debt of about JP¥1.80b.
How Healthy Is OptoelectronicsLtd's Balance Sheet?
According to the last reported balance sheet, OptoelectronicsLtd had liabilities of JP¥4.57b due within 12 months, and liabilities of JP¥3.60b due beyond 12 months. Offsetting this, it had JP¥4.41b in cash and JP¥1.49b in receivables that were due within 12 months. So its liabilities outweigh the sum of its cash and (near-term) receivables by JP¥2.28b.
This is a mountain of leverage relative to its market capitalization of JP¥3.08b. This suggests shareholders would be heavily diluted if the company needed to shore up its balance sheet in a hurry. When analysing debt levels, the balance sheet is the obvious place to start. But you can't view debt in total isolation; since OptoelectronicsLtd will need earnings to service that debt. So when considering debt, it's definitely worth looking at the earnings trend. Click here for an interactive snapshot.
In the last year OptoelectronicsLtd had a loss before interest and tax, and actually shrunk its revenue by 9.7%, to JP¥6.5b. That's not what we would hope to see.
Caveat Emptor
Importantly, OptoelectronicsLtd had an earnings before interest and tax (EBIT) loss over the last year. Indeed, it lost a very considerable JP¥309m at the EBIT level. When we look at that and recall the liabilities on its balance sheet, relative to cash, it seems unwise to us for the company to have any debt. Quite frankly we think the balance sheet is far from match-fit, although it could be improved with time. Another cause for caution is that is bled JP¥340m in negative free cash flow over the last twelve months. So suffice it to say we consider the stock very risky. When analysing debt levels, the balance sheet is the obvious place to start. However, not all investment risk resides within the balance sheet - far from it. For instance, we've identified 3 warning signs for OptoelectronicsLtd (1 is potentially serious) you should be aware of.
Of course, if you're the type of investor who prefers buying stocks without the burden of debt, then don't hesitate to discover our exclusive list of net cash growth stocks, today.
When trading OptoelectronicsLtd or any other investment, use the platform considered by many to be the Professional's Gateway to the Worlds Market, Interactive Brokers. You get the lowest-cost* trading on stocks, options, futures, forex, bonds and funds worldwide from a single integrated account. Promoted
New: AI Stock Screener & Alerts
Our new AI Stock Screener scans the market every day to uncover opportunities.
• Dividend Powerhouses (3%+ Yield)
• Undervalued Small Caps with Insider Buying
• High growth Tech and AI Companies
Or build your own from over 50 metrics.
This article by Simply Wall St is general in nature. It does not constitute a recommendation to buy or sell any stock, and does not take account of your objectives, or your financial situation. We aim to bring you long-term focused analysis driven by fundamental data. Note that our analysis may not factor in the latest price-sensitive company announcements or qualitative material. Simply Wall St has no position in any stocks mentioned.
*Interactive Brokers Rated Lowest Cost Broker by StockBrokers.com Annual Online Review 2020
Have feedback on this article? Concerned about the content? Get in touch with us directly. Alternatively, email editorial-team (at) simplywallst.com.
About TSE:6664
Optoelectronics
Develops, manufactures, and sells automatic identification devices in Japan, the United States the America, Europe, Asia, and internationally.
Flawless balance sheet and fair value.
Similar Companies
Market Insights

Advertisement
Community Narratives
MINISO's fair value is projected at 26.69 with an anticipated PE ratio shift of 20x
Fair Value US$24.03|9.0% undervalued
BE
Community Contributor
Procter & Gamble: A Dividend Giant Facing Slowing Growth
Fair Value US$119.81|23.5% overvalued
AN
Community Contributor
Eli Lilly's Future Growth Driven by Tirzepatide and Favorable Market Conditions
Fair Value US$1.19k|14.4% undervalued
EA
Community Contributor