
Advertisement
Is SMN Corporation's (TSE:6185) Recent Stock Performance Influenced By Its Fundamentals In Any Way?
SMN (TSE:6185) has had a great run on the share market with its stock up by a significant 10% over the last week. Given that stock prices are usually aligned with a company's financial performance in the long-term, we decided to study its financial indicators more closely to see if they had a hand to play in the recent price move. Particularly, we will be paying attention to SMN's ROE today.
Return on equity or ROE is a key measure used to assess how efficiently a company's management is utilizing the company's capital. Put another way, it reveals the company's success at turning shareholder investments into profits.
How Do You Calculate Return On Equity?
ROE can be calculated by using the formula:
Return on Equity = Net Profit (from continuing operations) ÷ Shareholders' Equity
So, based on the above formula, the ROE for SMN is:
9.2% = JP¥368m ÷ JP¥4.0b (Based on the trailing twelve months to June 2025).
The 'return' is the profit over the last twelve months. One way to conceptualize this is that for each ¥1 of shareholders' capital it has, the company made ¥0.09 in profit.
Check out our latest analysis for SMN
Why Is ROE Important For Earnings Growth?
So far, we've learned that ROE is a measure of a company's profitability. Depending on how much of these profits the company reinvests or "retains", and how effectively it does so, we are then able to assess a company’s earnings growth potential. Generally speaking, other things being equal, firms with a high return on equity and profit retention, have a higher growth rate than firms that don’t share these attributes.
SMN's Earnings Growth And 9.2% ROE
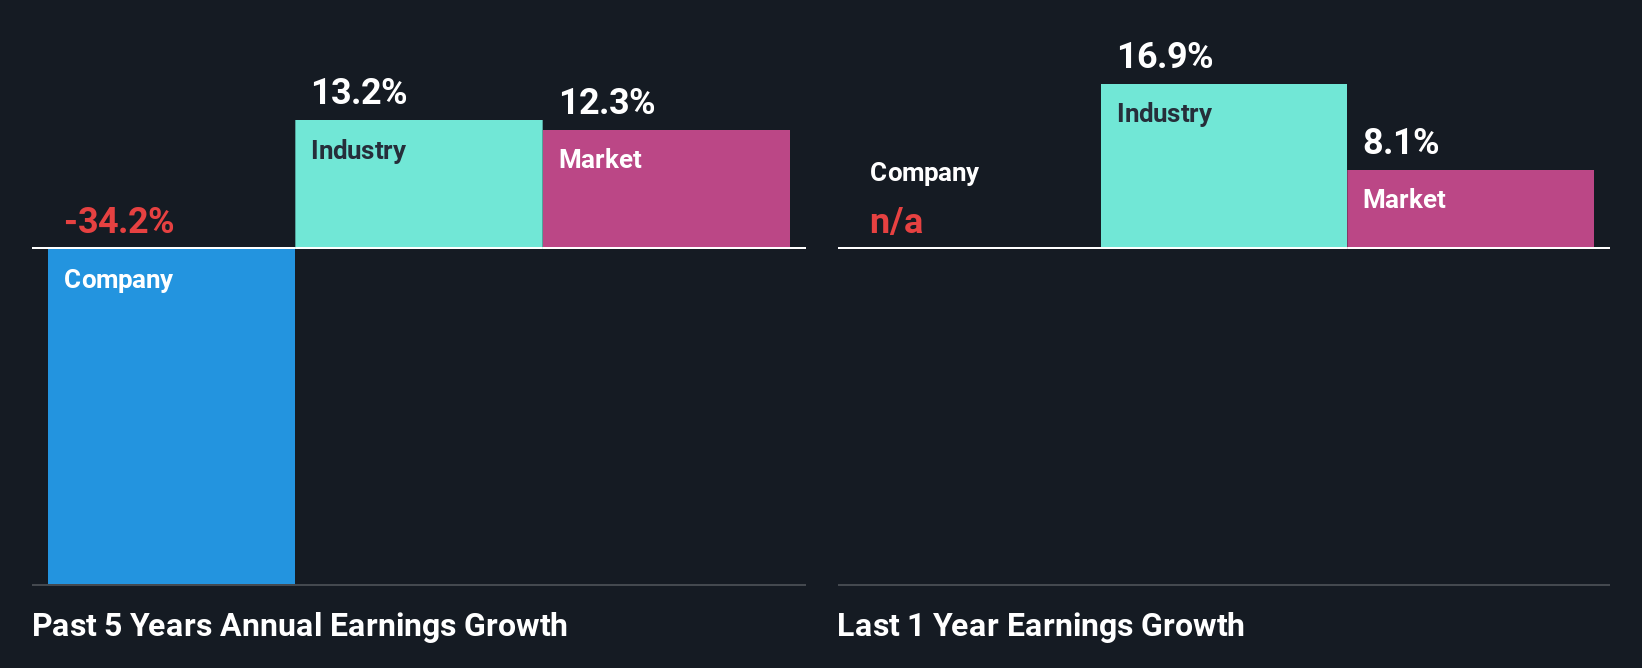
To start with, SMN's ROE looks acceptable. Yet, the fact that the company's ROE is lower than the industry average of 14% does temper our expectations. Moreover, SMN's net income shrunk at a rate of 34%over the past five years. Not to forget, the company does have a high ROE to begin with, just that it is lower than the industry average. Therefore, the shrinking earnings could be the result of other factors. For example, it could be that the company has a high payout ratio or the business has allocated capital poorly, for instance.
However, when we compared SMN's growth with the industry we found that while the company's earnings have been shrinking, the industry has seen an earnings growth of 13% in the same period. This is quite worrisome.
The basis for attaching value to a company is, to a great extent, tied to its earnings growth. The investor should try to establish if the expected growth or decline in earnings, whichever the case may be, is priced in. This then helps them determine if the stock is placed for a bright or bleak future. If you're wondering about SMN's's valuation, check out this gauge of its price-to-earnings ratio, as compared to its industry.
Is SMN Efficiently Re-investing Its Profits?
Because SMN doesn't pay any regular dividends, we infer that it is retaining all of its profits, which is rather perplexing when you consider the fact that there is no earnings growth to show for it. It looks like there might be some other reasons to explain the lack in that respect. For example, the business could be in decline.
Conclusion
Overall, we feel that SMN certainly does have some positive factors to consider. However, while the company does have a decent ROE and a high profit retention, its earnings growth number is quite disappointing. This suggests that there might be some external threat to the business, that's hampering growth. While we won't completely dismiss the company, what we would do, is try to ascertain how risky the business is to make a more informed decision around the company. To know the 4 risks we have identified for SMN visit our risks dashboard for free.
New: Manage All Your Stock Portfolios in One Place
We've created the ultimate portfolio companion for stock investors, and it's free.
• Connect an unlimited number of Portfolios and see your total in one currency
• Be alerted to new Warning Signs or Risks via email or mobile
• Track the Fair Value of your stocks
Have feedback on this article? Concerned about the content? Get in touch with us directly. Alternatively, email editorial-team (at) simplywallst.com.
This article by Simply Wall St is general in nature. We provide commentary based on historical data and analyst forecasts only using an unbiased methodology and our articles are not intended to be financial advice. It does not constitute a recommendation to buy or sell any stock, and does not take account of your objectives, or your financial situation. We aim to bring you long-term focused analysis driven by fundamental data. Note that our analysis may not factor in the latest price-sensitive company announcements or qualitative material. Simply Wall St has no position in any stocks mentioned.
About TSE:6185
Flawless balance sheet with slight risk.
Market Insights

Advertisement
Community Narratives
Finding The True Value Of A Logistics Powerhouse
Fair Value US$95.21|8.6% undervalued
NV
Community Contributor
Paradigm Biopharmaceuticals Will Lead Osteoarthritis Treatment with Zilosul's FDA Success
Fair Value AU$5.50|91.9% undervalued
AM
Community Contributor
Barrick Mining (ABX:CA): A Gold Hedge against a U.S. Shutdown
Fair Value CA$60.00|25.6% undervalued
GM
Community Contributor