Nihon Knowledge CoLtd's (TSE:5252) Promising Earnings May Rest On Soft Foundations

Investors were disappointed with Nihon Knowledge Co,Ltd.'s (TSE:5252) earnings, despite the strong profit numbers. We think that the market might be paying attention to some underlying factors that they find to be concerning.
Check out our latest analysis for Nihon Knowledge CoLtd
A Closer Look At Nihon Knowledge CoLtd's Earnings
As finance nerds would already know, the accrual ratio from cashflow is a key measure for assessing how well a company's free cash flow (FCF) matches its profit. In plain english, this ratio subtracts FCF from net profit, and divides that number by the company's average operating assets over that period. The ratio shows us how much a company's profit exceeds its FCF.
As a result, a negative accrual ratio is a positive for the company, and a positive accrual ratio is a negative. While it's not a problem to have a positive accrual ratio, indicating a certain level of non-cash profits, a high accrual ratio is arguably a bad thing, because it indicates paper profits are not matched by cash flow. That's because some academic studies have suggested that high accruals ratios tend to lead to lower profit or less profit growth.
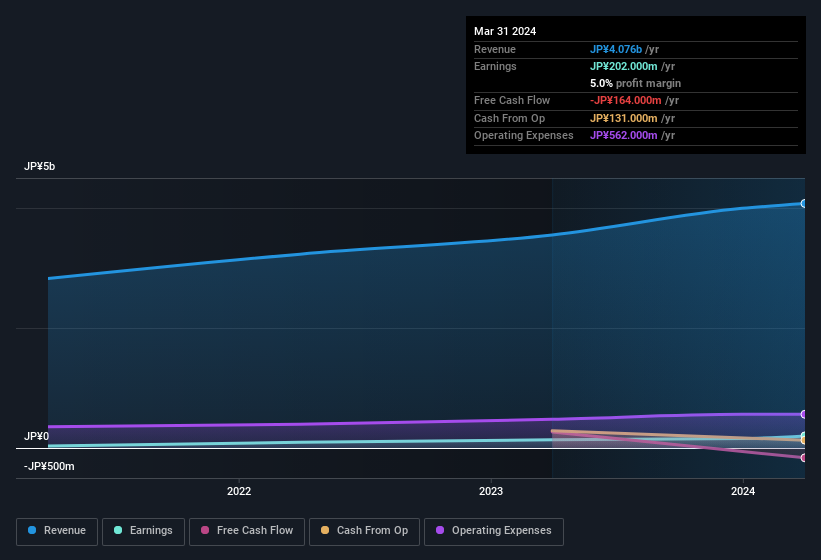
Nihon Knowledge CoLtd has an accrual ratio of 0.97 for the year to March 2024. As a general rule, that bodes poorly for future profitability. And indeed, during the period the company didn't produce any free cash flow whatsoever. Over the last year it actually had negative free cash flow of JP¥164m, in contrast to the aforementioned profit of JP¥202.0m. It's worth noting that Nihon Knowledge CoLtd generated positive FCF of JP¥267m a year ago, so at least they've done it in the past. The good news for shareholders is that Nihon Knowledge CoLtd's accrual ratio was much better last year, so this year's poor reading might simply be a case of a short term mismatch between profit and FCF. As a result, some shareholders may be looking for stronger cash conversion in the current year.
Note: we always recommend investors check balance sheet strength. Click here to be taken to our balance sheet analysis of Nihon Knowledge CoLtd.
Our Take On Nihon Knowledge CoLtd's Profit Performance
As we have made quite clear, we're a bit worried that Nihon Knowledge CoLtd didn't back up the last year's profit with free cashflow. For this reason, we think that Nihon Knowledge CoLtd's statutory profits may be a bad guide to its underlying earnings power, and might give investors an overly positive impression of the company. But on the bright side, its earnings per share have grown at an extremely impressive rate over the last three years. The goal of this article has been to assess how well we can rely on the statutory earnings to reflect the company's potential, but there is plenty more to consider. In light of this, if you'd like to do more analysis on the company, it's vital to be informed of the risks involved. Be aware that Nihon Knowledge CoLtd is showing 2 warning signs in our investment analysis and 1 of those is potentially serious...
This note has only looked at a single factor that sheds light on the nature of Nihon Knowledge CoLtd's profit. But there are plenty of other ways to inform your opinion of a company. For example, many people consider a high return on equity as an indication of favorable business economics, while others like to 'follow the money' and search out stocks that insiders are buying. So you may wish to see this free collection of companies boasting high return on equity, or this list of stocks with high insider ownership.
The New Payments ETF Is Live on NASDAQ:
Money is moving to real-time rails, and a newly listed ETF now gives investors direct exposure. Fast settlement. Institutional custody. Simple access.
Explore how this launch could reshape portfolios
Sponsored ContentValuation is complex, but we're here to simplify it.
Discover if Nihon Knowledge CoLtd might be undervalued or overvalued with our detailed analysis, featuring fair value estimates, potential risks, dividends, insider trades, and its financial condition.
Access Free AnalysisHave feedback on this article? Concerned about the content? Get in touch with us directly. Alternatively, email editorial-team (at) simplywallst.com.
This article by Simply Wall St is general in nature. We provide commentary based on historical data and analyst forecasts only using an unbiased methodology and our articles are not intended to be financial advice. It does not constitute a recommendation to buy or sell any stock, and does not take account of your objectives, or your financial situation. We aim to bring you long-term focused analysis driven by fundamental data. Note that our analysis may not factor in the latest price-sensitive company announcements or qualitative material. Simply Wall St has no position in any stocks mentioned.
About TSE:5252
Nihon Knowledge CoLtd
Provides software system verification services, system contract development, and business system package in Japan.
Excellent balance sheet with questionable track record.
Market Insights

Weekly Picks

Early mover in a fast growing industry. Likely to experience share price volatility as they scale


A case for CA$31.80 (undiluted), aka 8,616% upside from CA$0.37 (an 86 bagger!).


Moderation and Stabilisation: HOLD: Fair Price based on a 4-year Cycle is $12.08
Recently Updated Narratives


Title: Market Sentiment Is Dead Wrong — Here's Why PSEC Deserves a Second Look


An amazing opportunity to potentially get a 100 bagger

Amazon: Why the World’s Biggest Platform Still Runs on Invisible Economics
Popular Narratives


MicroVision will explode future revenue by 380.37% with a vision towards success


Crazy Undervalued 42 Baggers Silver Play (Active & Running Mine)


NVDA: Expanding AI Demand Will Drive Major Data Center Investments Through 2026
Trending Discussion
