Advertisement
Rakus (TSE:3923) Valuation: Assessing Shares After September Sales Reveal Strong Momentum

Simply Wall St
Reviewed by Simply Wall St
Rakus (TSE:3923) just shared its consolidated sales figures for September of Fiscal Year 2026, coming in at JPY 4,975 million. These monthly results provide investors with a timely glimpse into how the company’s business is trending.
See our latest analysis for Rakus.
Rakus shares have delivered a robust 44.98% year-to-date price return, reflecting strong momentum as investors respond to its consistent operational growth and recent sales update. Over the last year, the total shareholder return stands at 26.07%, showcasing both near-term gains and enduring confidence in the company’s long-term prospects.
If Rakus’s growth streak has you curious about other opportunities, take the next step and discover fast growing stocks with high insider ownership.
With a sustained rally and ongoing sales growth, the key question now is whether Rakus stock remains undervalued after its sharp gains, or if the market is already pricing in all of its future upside.
Price-to-Earnings of 49.2x: Is it justified?
Rakus is currently trading at a price-to-earnings (P/E) ratio of 49.2x, which is below the peer average of 64.3x but well above the industry average of 22.1x. This high multiple suggests the market is willing to pay a premium for the company's future earnings potential.
The P/E ratio reflects what investors are prepared to pay for each yen of Rakus’s earnings. Software companies often carry higher multiples because of their scalable business models and growth prospects, but this still warrants scrutiny given Rakus’s rapid expansion.
Although Rakus is cheaper than direct peers on a P/E basis, its valuation remains significantly above the sector’s typical level and even exceeds its estimated fair P/E of 34x by a considerable margin. This implies investors are factoring in robust profit growth expectations, and any shortfall could result in this multiple moving closer to industry norms or the fair ratio benchmark.
Explore the SWS fair ratio for Rakus
Result: Price-to-Earnings of 49.2x (OVERVALUED)
However, slower revenue growth or a correction in market sentiment could quickly challenge Rakus’s elevated valuation and investor confidence.
Find out about the key risks to this Rakus narrative.
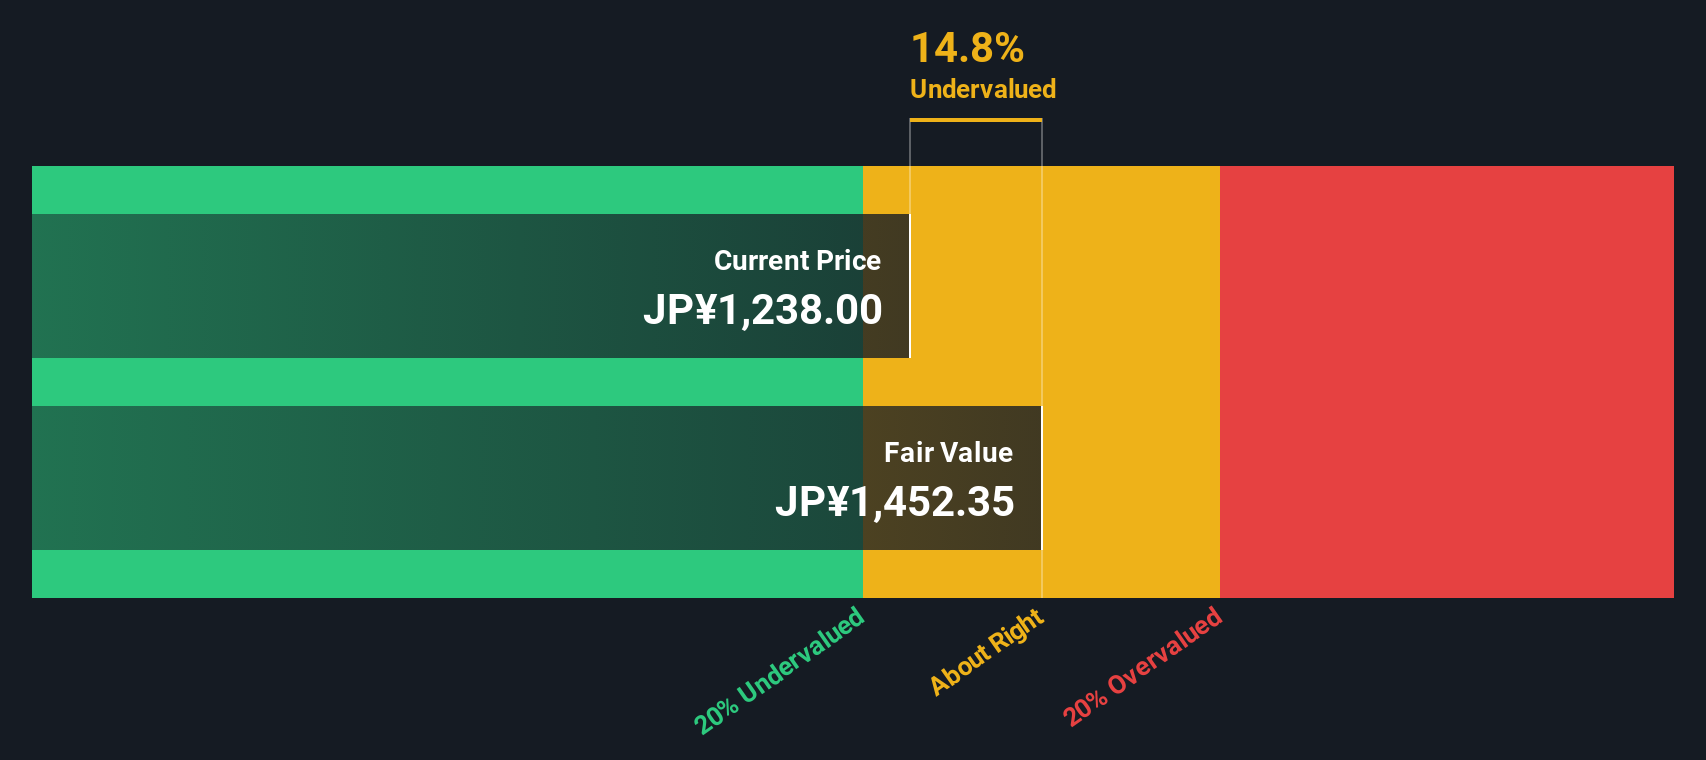
Another View: SWS DCF Model Suggests Undervaluation
While the price-to-earnings ratio hints at Rakus being overvalued, our SWS DCF model presents a different perspective. This approach indicates the shares are trading about 11% below their estimated fair value, which puts the stock in potentially undervalued territory based on projected future cash flows.
Look into how the SWS DCF model arrives at its fair value.
Could the market be underestimating Rakus’s longer-term upside, or is the high earnings multiple flagging hidden risks? The debate continues, and investors may want to weigh both views carefully.
Simply Wall St performs a discounted cash flow (DCF) on every stock in the world every day (check out Rakus for example). We show the entire calculation in full. You can track the result in your watchlist or portfolio and be alerted when this changes, or use our stock screener to discover undervalued stocks based on their cash flows. If you save a screener we even alert you when new companies match - so you never miss a potential opportunity.
Build Your Own Rakus Narrative
If you want to interpret the numbers your own way or prefer a hands-on approach, you can shape your own view in just a few minutes with Do it your way.
A good starting point is our analysis highlighting 3 key rewards investors are optimistic about regarding Rakus.
Looking for more investment ideas?
Don’t limit your portfolio. Fresh opportunities await when you use the Simply Wall Street Screener to hand-pick stocks that fit your goals and interests.
- Catch income opportunities and secure long-term returns by checking out these 19 dividend stocks with yields > 3% with yields above 3%.
- Ride the AI wave and spot market movers early through these 27 AI penny stocks poised to harness artificial intelligence.
- Capitalize on sector momentum in healthcare by screening for tomorrow’s leaders with these 34 healthcare AI stocks.
This article by Simply Wall St is general in nature. We provide commentary based on historical data and analyst forecasts only using an unbiased methodology and our articles are not intended to be financial advice. It does not constitute a recommendation to buy or sell any stock, and does not take account of your objectives, or your financial situation. We aim to bring you long-term focused analysis driven by fundamental data. Note that our analysis may not factor in the latest price-sensitive company announcements or qualitative material. Simply Wall St has no position in any stocks mentioned.
New: AI Stock Screener & Alerts
Our new AI Stock Screener scans the market every day to uncover opportunities.
• Dividend Powerhouses (3%+ Yield)
• Undervalued Small Caps with Insider Buying
• High growth Tech and AI Companies
Or build your own from over 50 metrics.
Have feedback on this article? Concerned about the content? Get in touch with us directly. Alternatively, email editorial-team@simplywallst.com
About TSE:3923
Outstanding track record with flawless balance sheet.
Market Insights

Advertisement
Community Narratives
The company that turned a verb into a global necessity and basically runs the modern internet, digital ads, smartphones, maps, and AI.
Fair Value US$300.00|10.2% undervalued
OS
Community Contributor
Flowers Foods Pays A Fair Price For Health
Fair Value US$16.12|20.3% undervalued
NV
Community Contributor
TMX Group will thrive with 33.3% profit margin and enduring market moat
Fair Value CA$49.90|0.1% undervalued
LI
Community Contributor