
Advertisement
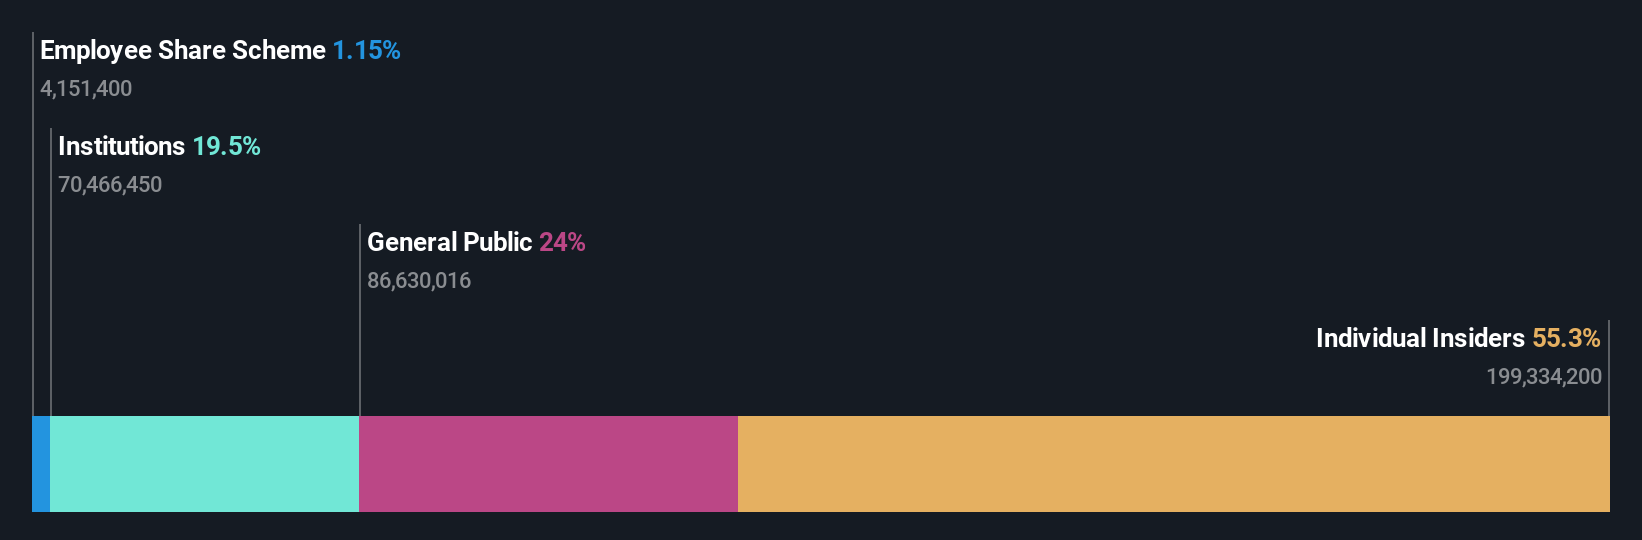
Rakus Co., Ltd. (TSE:3923) insiders have significant skin in the game with 55% ownership
Key Insights
- Insiders appear to have a vested interest in Rakus' growth, as seen by their sizeable ownership
- 52% of the business is held by the top 5 shareholders
- Institutions own 20% of Rakus
A look at the shareholders of Rakus Co., Ltd. (TSE:3923) can tell us which group is most powerful. With 55% stake, individual insiders possess the maximum shares in the company. Put another way, the group faces the maximum upside potential (or downside risk).
So, insiders of Rakus have a lot at stake and every decision they make on the company’s future is important to them from a financial point of view.
In the chart below, we zoom in on the different ownership groups of Rakus.
See our latest analysis for Rakus
What Does The Institutional Ownership Tell Us About Rakus?
Institutions typically measure themselves against a benchmark when reporting to their own investors, so they often become more enthusiastic about a stock once it's included in a major index. We would expect most companies to have some institutions on the register, especially if they are growing.
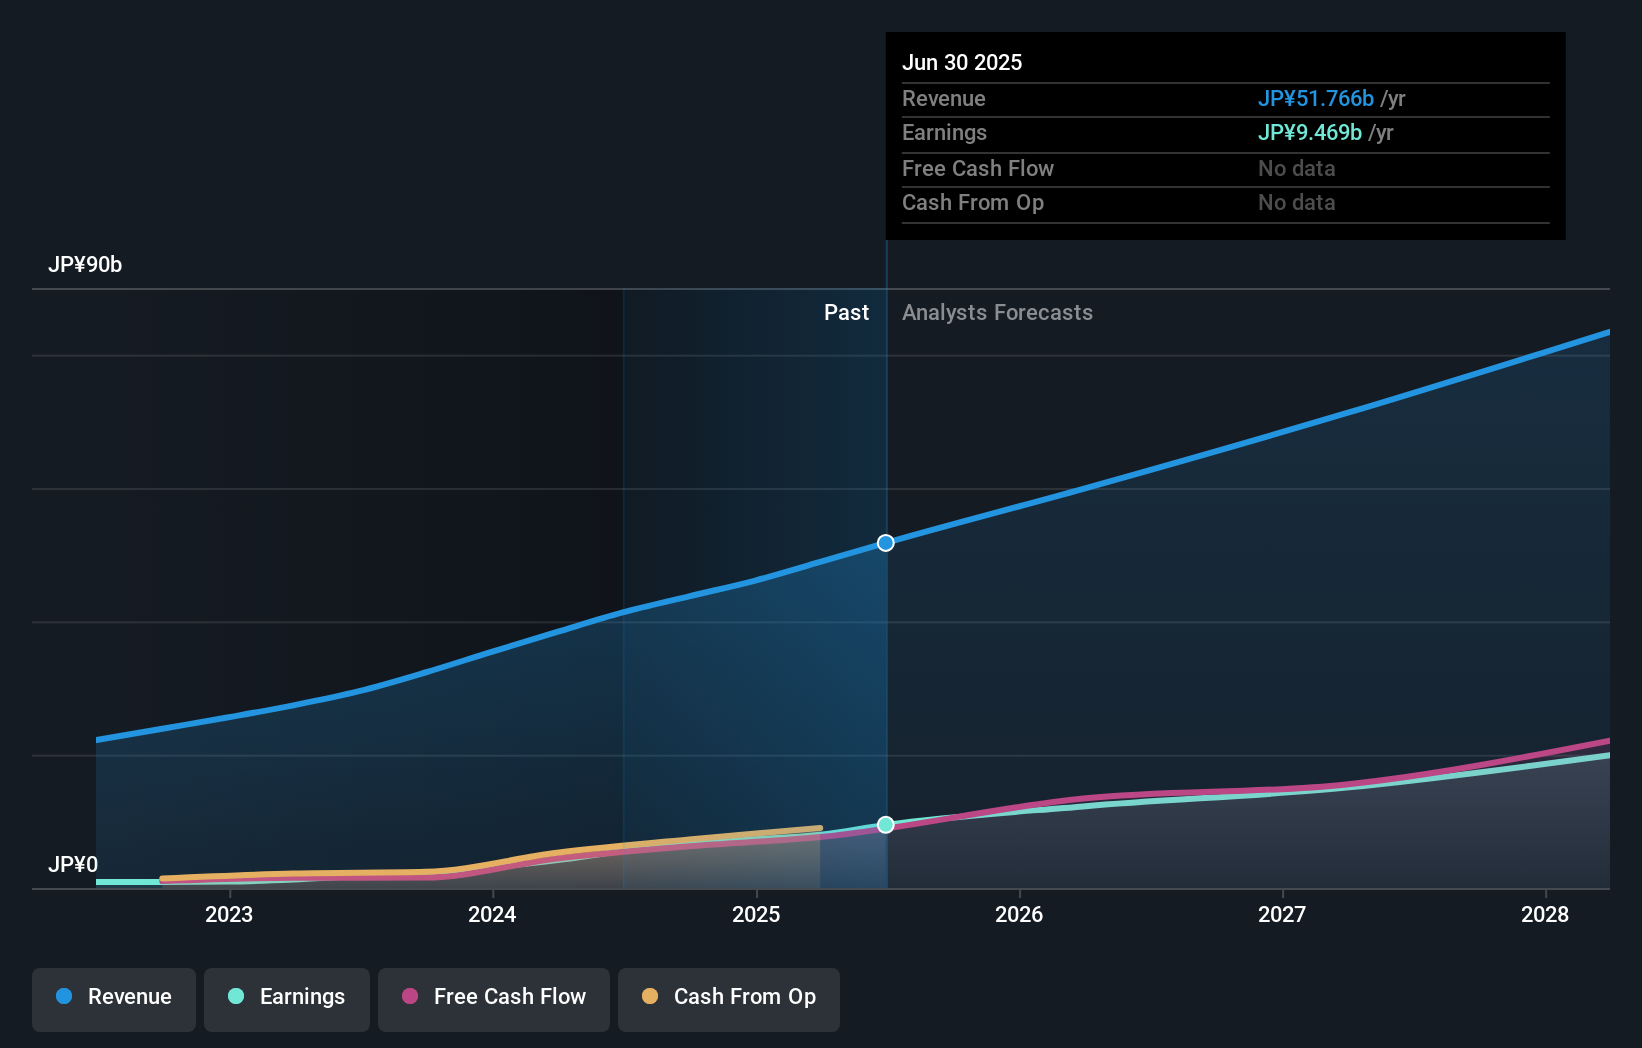
We can see that Rakus does have institutional investors; and they hold a good portion of the company's stock. This can indicate that the company has a certain degree of credibility in the investment community. However, it is best to be wary of relying on the supposed validation that comes with institutional investors. They too, get it wrong sometimes. If multiple institutions change their view on a stock at the same time, you could see the share price drop fast. It's therefore worth looking at Rakus' earnings history below. Of course, the future is what really matters.
Hedge funds don't have many shares in Rakus. Looking at our data, we can see that the largest shareholder is the CEO Takanori Nakamura with 34% of shares outstanding. In comparison, the second and third largest shareholders hold about 4.9% and 4.9% of the stock. Interestingly, the third-largest shareholder, Shinichiro Motomatsu is also a Member of the Board of Directors, again, indicating strong insider ownership amongst the company's top shareholders.
Our research also brought to light the fact that roughly 52% of the company is controlled by the top 5 shareholders suggesting that these owners wield significant influence on the business.
Researching institutional ownership is a good way to gauge and filter a stock's expected performance. The same can be achieved by studying analyst sentiments. There are a reasonable number of analysts covering the stock, so it might be useful to find out their aggregate view on the future.
Insider Ownership Of Rakus
The definition of company insiders can be subjective and does vary between jurisdictions. Our data reflects individual insiders, capturing board members at the very least. Management ultimately answers to the board. However, it is not uncommon for managers to be executive board members, especially if they are a founder or the CEO.
Most consider insider ownership a positive because it can indicate the board is well aligned with other shareholders. However, on some occasions too much power is concentrated within this group.
Our most recent data indicates that insiders own the majority of Rakus Co., Ltd.. This means they can collectively make decisions for the company. Given it has a market cap of JP¥473b, that means insiders have a whopping JP¥262b worth of shares in their own names. Most would be pleased to see the board is investing alongside them. You may wish to discover if they have been buying or selling.
General Public Ownership
With a 24% ownership, the general public, mostly comprising of individual investors, have some degree of sway over Rakus. While this group can't necessarily call the shots, it can certainly have a real influence on how the company is run.
Next Steps:
It's always worth thinking about the different groups who own shares in a company. But to understand Rakus better, we need to consider many other factors.
I like to dive deeper into how a company has performed in the past. You can access this interactive graph of past earnings, revenue and cash flow, for free.
If you would prefer discover what analysts are predicting in terms of future growth, do not miss this free report on analyst forecasts.
NB: Figures in this article are calculated using data from the last twelve months, which refer to the 12-month period ending on the last date of the month the financial statement is dated. This may not be consistent with full year annual report figures.
New: AI Stock Screener & Alerts
Our new AI Stock Screener scans the market every day to uncover opportunities.
• Dividend Powerhouses (3%+ Yield)
• Undervalued Small Caps with Insider Buying
• High growth Tech and AI Companies
Or build your own from over 50 metrics.
Have feedback on this article? Concerned about the content? Get in touch with us directly. Alternatively, email editorial-team (at) simplywallst.com.
This article by Simply Wall St is general in nature. We provide commentary based on historical data and analyst forecasts only using an unbiased methodology and our articles are not intended to be financial advice. It does not constitute a recommendation to buy or sell any stock, and does not take account of your objectives, or your financial situation. We aim to bring you long-term focused analysis driven by fundamental data. Note that our analysis may not factor in the latest price-sensitive company announcements or qualitative material. Simply Wall St has no position in any stocks mentioned.
About TSE:3923
Outstanding track record with flawless balance sheet.
Market Insights

Advertisement
Community Narratives
MicroVision will explode future revenue by 380.37% with a vision towards success
Fair Value US$60.00|98.4% undervalued
TH
Community Contributor
The Indispensable Artery for a New North American Economy
Fair Value CA$132.87|1.3% undervalued
TI
Community Contributor