
Advertisement
Some say volatility, rather than debt, is the best way to think about risk as an investor, but Warren Buffett famously said that 'Volatility is far from synonymous with risk.' It's only natural to consider a company's balance sheet when you examine how risky it is, since debt is often involved when a business collapses. As with many other companies EDP Corporation (TSE:7794) makes use of debt. But should shareholders be worried about its use of debt?
What Risk Does Debt Bring?
Debt assists a business until the business has trouble paying it off, either with new capital or with free cash flow. In the worst case scenario, a company can go bankrupt if it cannot pay its creditors. However, a more common (but still painful) scenario is that it has to raise new equity capital at a low price, thus permanently diluting shareholders. By replacing dilution, though, debt can be an extremely good tool for businesses that need capital to invest in growth at high rates of return. The first thing to do when considering how much debt a business uses is to look at its cash and debt together.
See our latest analysis for EDP
How Much Debt Does EDP Carry?
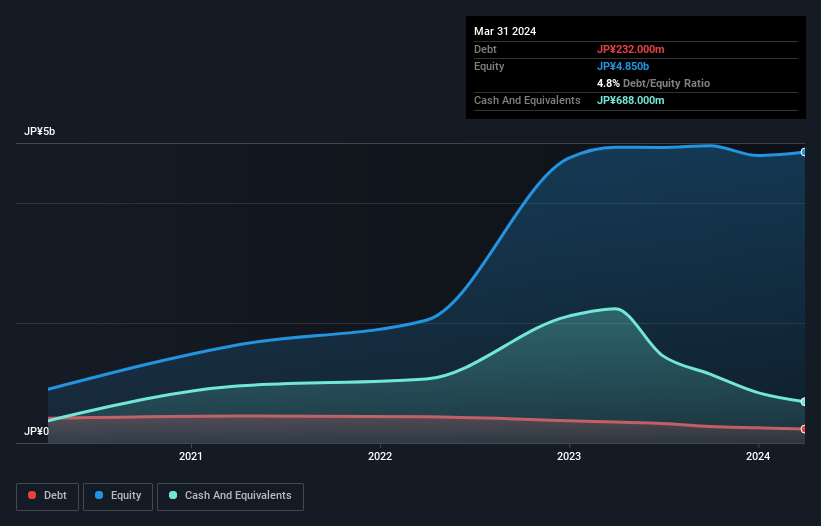
The image below, which you can click on for greater detail, shows that EDP had debt of JP¥232.0m at the end of March 2024, a reduction from JP¥349.0m over a year. However, it does have JP¥688.0m in cash offsetting this, leading to net cash of JP¥456.0m.
A Look At EDP's Liabilities
We can see from the most recent balance sheet that EDP had liabilities of JP¥220.0m falling due within a year, and liabilities of JP¥267.0m due beyond that. Offsetting these obligations, it had cash of JP¥688.0m as well as receivables valued at JP¥95.0m due within 12 months. So it can boast JP¥296.0m more liquid assets than total liabilities.
This short term liquidity is a sign that EDP could probably pay off its debt with ease, as its balance sheet is far from stretched. Simply put, the fact that EDP has more cash than debt is arguably a good indication that it can manage its debt safely. There's no doubt that we learn most about debt from the balance sheet. But it is EDP's earnings that will influence how the balance sheet holds up in the future. So when considering debt, it's definitely worth looking at the earnings trend. Click here for an interactive snapshot.
In the last year EDP had a loss before interest and tax, and actually shrunk its revenue by 72%, to JP¥757m. To be frank that doesn't bode well.
So How Risky Is EDP?
By their very nature companies that are losing money are more risky than those with a long history of profitability. And we do note that EDP had an earnings before interest and tax (EBIT) loss, over the last year. And over the same period it saw negative free cash outflow of JP¥1.5b and booked a JP¥111m accounting loss. Given it only has net cash of JP¥456.0m, the company may need to raise more capital if it doesn't reach break-even soon. Overall, its balance sheet doesn't seem overly risky, at the moment, but we're always cautious until we see the positive free cash flow. There's no doubt that we learn most about debt from the balance sheet. However, not all investment risk resides within the balance sheet - far from it. We've identified 2 warning signs with EDP , and understanding them should be part of your investment process.
Of course, if you're the type of investor who prefers buying stocks without the burden of debt, then don't hesitate to discover our exclusive list of net cash growth stocks, today.
Valuation is complex, but we're here to simplify it.
Discover if EDP might be undervalued or overvalued with our detailed analysis, featuring fair value estimates, potential risks, dividends, insider trades, and its financial condition.
Access Free AnalysisHave feedback on this article? Concerned about the content? Get in touch with us directly. Alternatively, email editorial-team (at) simplywallst.com.
This article by Simply Wall St is general in nature. We provide commentary based on historical data and analyst forecasts only using an unbiased methodology and our articles are not intended to be financial advice. It does not constitute a recommendation to buy or sell any stock, and does not take account of your objectives, or your financial situation. We aim to bring you long-term focused analysis driven by fundamental data. Note that our analysis may not factor in the latest price-sensitive company announcements or qualitative material. Simply Wall St has no position in any stocks mentioned.
About TSE:7794
EDP
Engages in the fabrication and sale of single crystal synthetic diamonds and related products.
Slight risk with mediocre balance sheet.
Market Insights

Advertisement
Community Narratives
Finding The True Value Of A Logistics Powerhouse
Fair Value US$95.21|7.5% undervalued
NV
Community Contributor
Paradigm Biopharmaceuticals Will Lead Osteoarthritis Treatment with Zilosul's FDA Success
Fair Value AU$5.50|93.3% undervalued
AM
Community Contributor
Barrick Mining (ABX:CA): A Gold Hedge against a U.S. Shutdown
Fair Value CA$60.00|26.4% undervalued
GM
Community Contributor