- Japan
- /
- Semiconductors
- /
- TSE:7735
Is SCREEN Holdings Co., Ltd.'s (TSE:7735) Latest Stock Performance A Reflection Of Its Financial Health?


SCREEN Holdings' (TSE:7735) stock is up by a considerable 20% over the past three months. Given the company's impressive performance, we decided to study its financial indicators more closely as a company's financial health over the long-term usually dictates market outcomes. Specifically, we decided to study SCREEN Holdings' ROE in this article.
Return on Equity or ROE is a test of how effectively a company is growing its value and managing investors’ money. In short, ROE shows the profit each dollar generates with respect to its shareholder investments.
See our latest analysis for SCREEN Holdings
How Do You Calculate Return On Equity?
ROE can be calculated by using the formula:
Return on Equity = Net Profit (from continuing operations) ÷ Shareholders' Equity
So, based on the above formula, the ROE for SCREEN Holdings is:
23% = JP¥96b ÷ JP¥416b (Based on the trailing twelve months to December 2024).
The 'return' refers to a company's earnings over the last year. One way to conceptualize this is that for each ¥1 of shareholders' capital it has, the company made ¥0.23 in profit.
Why Is ROE Important For Earnings Growth?
So far, we've learned that ROE is a measure of a company's profitability. Depending on how much of these profits the company reinvests or "retains", and how effectively it does so, we are then able to assess a company’s earnings growth potential. Generally speaking, other things being equal, firms with a high return on equity and profit retention, have a higher growth rate than firms that don’t share these attributes.
SCREEN Holdings' Earnings Growth And 23% ROE
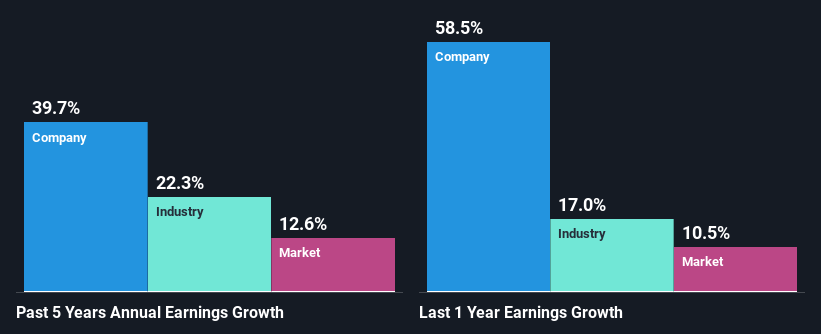
First thing first, we like that SCREEN Holdings has an impressive ROE. Additionally, the company's ROE is higher compared to the industry average of 11% which is quite remarkable. Under the circumstances, SCREEN Holdings' considerable five year net income growth of 40% was to be expected.
Next, on comparing with the industry net income growth, we found that SCREEN Holdings' growth is quite high when compared to the industry average growth of 22% in the same period, which is great to see.
The basis for attaching value to a company is, to a great extent, tied to its earnings growth. What investors need to determine next is if the expected earnings growth, or the lack of it, is already built into the share price. Doing so will help them establish if the stock's future looks promising or ominous. Is 7735 fairly valued? This infographic on the company's intrinsic value has everything you need to know.
Is SCREEN Holdings Using Its Retained Earnings Effectively?
SCREEN Holdings' three-year median payout ratio is a pretty moderate 30%, meaning the company retains 70% of its income. By the looks of it, the dividend is well covered and SCREEN Holdings is reinvesting its profits efficiently as evidenced by its exceptional growth which we discussed above.
Moreover, SCREEN Holdings is determined to keep sharing its profits with shareholders which we infer from its long history of paying a dividend for at least ten years.
Conclusion
Overall, we are quite pleased with SCREEN Holdings' performance. Specifically, we like that the company is reinvesting a huge chunk of its profits at a high rate of return. This of course has caused the company to see substantial growth in its earnings. With that said, the latest industry analyst forecasts reveal that the company's earnings growth is expected to slow down. To know more about the company's future earnings growth forecasts take a look at this free report on analyst forecasts for the company to find out more.
New: Manage All Your Stock Portfolios in One Place
We've created the ultimate portfolio companion for stock investors, and it's free.
• Connect an unlimited number of Portfolios and see your total in one currency
• Be alerted to new Warning Signs or Risks via email or mobile
• Track the Fair Value of your stocks
Have feedback on this article? Concerned about the content? Get in touch with us directly. Alternatively, email editorial-team (at) simplywallst.com.
This article by Simply Wall St is general in nature. We provide commentary based on historical data and analyst forecasts only using an unbiased methodology and our articles are not intended to be financial advice. It does not constitute a recommendation to buy or sell any stock, and does not take account of your objectives, or your financial situation. We aim to bring you long-term focused analysis driven by fundamental data. Note that our analysis may not factor in the latest price-sensitive company announcements or qualitative material. Simply Wall St has no position in any stocks mentioned.
About TSE:7735
SCREEN Holdings
Develops, manufactures, sells, and maintains semiconductor production equipment in Japan.
Flawless balance sheet, undervalued and pays a dividend.
Similar Companies
Market Insights

Community Narratives

