- Japan
- /
- Semiconductors
- /
- TSE:7735
Investors in SCREEN Holdings (TSE:7735) have seen massive returns of 640% over the past five years


For many, the main point of investing in the stock market is to achieve spectacular returns. While the best companies are hard to find, but they can generate massive returns over long periods. For example, the SCREEN Holdings Co., Ltd. (TSE:7735) share price is up a whopping 576% in the last half decade, a handsome return for long term holders. This just goes to show the value creation that some businesses can achieve. In contrast, the stock has fallen 9.0% in the last 30 days. We love happy stories like this one. The company should be really proud of that performance!
With that in mind, it's worth seeing if the company's underlying fundamentals have been the driver of long term performance, or if there are some discrepancies.
See our latest analysis for SCREEN Holdings
There is no denying that markets are sometimes efficient, but prices do not always reflect underlying business performance. One way to examine how market sentiment has changed over time is to look at the interaction between a company's share price and its earnings per share (EPS).
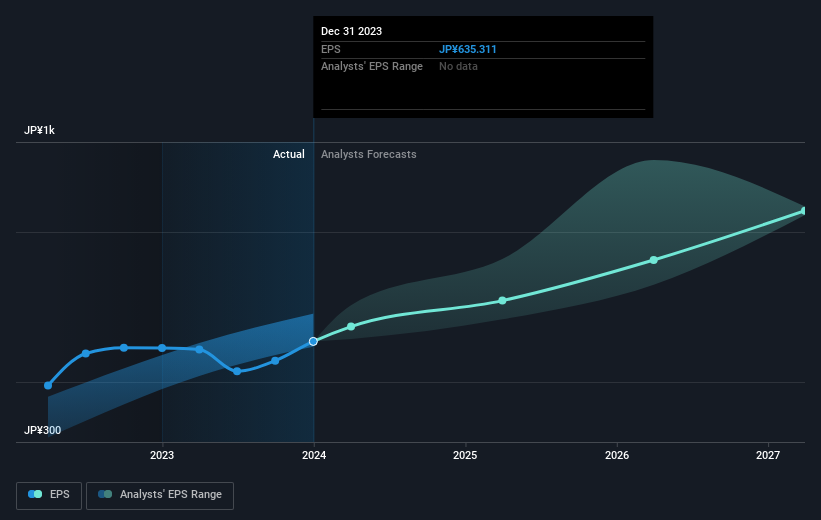
Over half a decade, SCREEN Holdings managed to grow its earnings per share at 20% a year. This EPS growth is slower than the share price growth of 47% per year, over the same period. So it's fair to assume the market has a higher opinion of the business than it did five years ago. That's not necessarily surprising considering the five-year track record of earnings growth.
The company's earnings per share (over time) is depicted in the image below (click to see the exact numbers).
We know that SCREEN Holdings has improved its bottom line over the last three years, but what does the future have in store? This free interactive report on SCREEN Holdings' balance sheet strength is a great place to start, if you want to investigate the stock further.
What About Dividends?
As well as measuring the share price return, investors should also consider the total shareholder return (TSR). Whereas the share price return only reflects the change in the share price, the TSR includes the value of dividends (assuming they were reinvested) and the benefit of any discounted capital raising or spin-off. It's fair to say that the TSR gives a more complete picture for stocks that pay a dividend. In the case of SCREEN Holdings, it has a TSR of 640% for the last 5 years. That exceeds its share price return that we previously mentioned. And there's no prize for guessing that the dividend payments largely explain the divergence!
A Different Perspective
It's nice to see that SCREEN Holdings shareholders have received a total shareholder return of 204% over the last year. And that does include the dividend. That gain is better than the annual TSR over five years, which is 49%. Therefore it seems like sentiment around the company has been positive lately. Someone with an optimistic perspective could view the recent improvement in TSR as indicating that the business itself is getting better with time. I find it very interesting to look at share price over the long term as a proxy for business performance. But to truly gain insight, we need to consider other information, too. Take risks, for example - SCREEN Holdings has 1 warning sign we think you should be aware of.
Of course SCREEN Holdings may not be the best stock to buy. So you may wish to see this free collection of growth stocks.
Please note, the market returns quoted in this article reflect the market weighted average returns of stocks that currently trade on Japanese exchanges.
If you're looking to trade SCREEN Holdings, open an account with the lowest-cost platform trusted by professionals, Interactive Brokers.
With clients in over 200 countries and territories, and access to 160 markets, IBKR lets you trade stocks, options, futures, forex, bonds and funds from a single integrated account.
Enjoy no hidden fees, no account minimums, and FX conversion rates as low as 0.03%, far better than what most brokers offer.
Sponsored ContentNew: Manage All Your Stock Portfolios in One Place
We've created the ultimate portfolio companion for stock investors, and it's free.
• Connect an unlimited number of Portfolios and see your total in one currency
• Be alerted to new Warning Signs or Risks via email or mobile
• Track the Fair Value of your stocks
Have feedback on this article? Concerned about the content? Get in touch with us directly. Alternatively, email editorial-team (at) simplywallst.com.
This article by Simply Wall St is general in nature. We provide commentary based on historical data and analyst forecasts only using an unbiased methodology and our articles are not intended to be financial advice. It does not constitute a recommendation to buy or sell any stock, and does not take account of your objectives, or your financial situation. We aim to bring you long-term focused analysis driven by fundamental data. Note that our analysis may not factor in the latest price-sensitive company announcements or qualitative material. Simply Wall St has no position in any stocks mentioned.
About TSE:7735
SCREEN Holdings
Develops, manufactures, sells, and maintains semiconductor production equipment in Japan.
Flawless balance sheet and undervalued.
Similar Companies
Market Insights

Community Narratives

