
Advertisement
- Japan
- /
- Semiconductors
- /
- TSE:6844
Lacklustre Performance Is Driving Shindengen Electric Manufacturing Co.,Ltd.'s (TSE:6844) 29% Price Drop
Shindengen Electric Manufacturing Co.,Ltd. (TSE:6844) shareholders that were waiting for something to happen have been dealt a blow with a 29% share price drop in the last month. Instead of being rewarded, shareholders who have already held through the last twelve months are now sitting on a 37% share price drop.
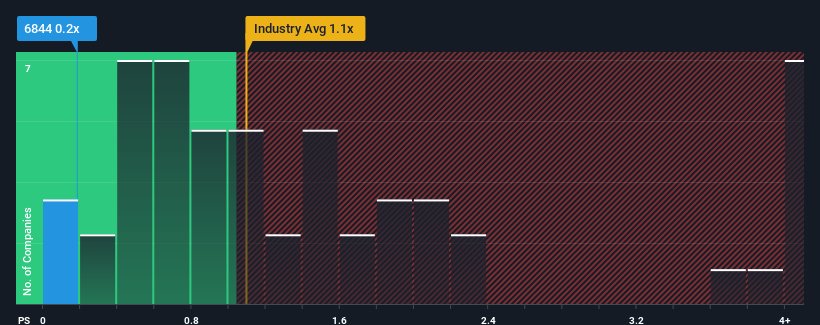
Following the heavy fall in price, it would be understandable if you think Shindengen Electric ManufacturingLtd is a stock with good investment prospects with a price-to-sales ratios (or "P/S") of 0.2x, considering almost half the companies in Japan's Semiconductor industry have P/S ratios above 1.1x. Although, it's not wise to just take the P/S at face value as there may be an explanation why it's limited.
Check out our latest analysis for Shindengen Electric ManufacturingLtd
How Has Shindengen Electric ManufacturingLtd Performed Recently?
With revenue growth that's inferior to most other companies of late, Shindengen Electric ManufacturingLtd has been relatively sluggish. Perhaps the market is expecting the current trend of poor revenue growth to continue, which has kept the P/S suppressed. If you still like the company, you'd be hoping revenue doesn't get any worse and that you could pick up some stock while it's out of favour.
Want the full picture on analyst estimates for the company? Then our free report on Shindengen Electric ManufacturingLtd will help you uncover what's on the horizon.What Are Revenue Growth Metrics Telling Us About The Low P/S?
The only time you'd be truly comfortable seeing a P/S as low as Shindengen Electric ManufacturingLtd's is when the company's growth is on track to lag the industry.
Retrospectively, the last year delivered virtually the same number to the company's top line as the year before. Still, the latest three year period was better as it's delivered a decent 14% overall rise in revenue. So it appears to us that the company has had a mixed result in terms of growing revenue over that time.
Looking ahead now, revenue is anticipated to climb by 3.3% during the coming year according to the lone analyst following the company. That's shaping up to be materially lower than the 8.5% growth forecast for the broader industry.
In light of this, it's understandable that Shindengen Electric ManufacturingLtd's P/S sits below the majority of other companies. Apparently many shareholders weren't comfortable holding on while the company is potentially eyeing a less prosperous future.
The Key Takeaway
The southerly movements of Shindengen Electric ManufacturingLtd's shares means its P/S is now sitting at a pretty low level. While the price-to-sales ratio shouldn't be the defining factor in whether you buy a stock or not, it's quite a capable barometer of revenue expectations.
As expected, our analysis of Shindengen Electric ManufacturingLtd's analyst forecasts confirms that the company's underwhelming revenue outlook is a major contributor to its low P/S. Right now shareholders are accepting the low P/S as they concede future revenue probably won't provide any pleasant surprises. The company will need a change of fortune to justify the P/S rising higher in the future.
Before you take the next step, you should know about the 1 warning sign for Shindengen Electric ManufacturingLtd that we have uncovered.
If you're unsure about the strength of Shindengen Electric ManufacturingLtd's business, why not explore our interactive list of stocks with solid business fundamentals for some other companies you may have missed.
New: Manage All Your Stock Portfolios in One Place
We've created the ultimate portfolio companion for stock investors, and it's free.
• Connect an unlimited number of Portfolios and see your total in one currency
• Be alerted to new Warning Signs or Risks via email or mobile
• Track the Fair Value of your stocks
Have feedback on this article? Concerned about the content? Get in touch with us directly. Alternatively, email editorial-team (at) simplywallst.com.
This article by Simply Wall St is general in nature. We provide commentary based on historical data and analyst forecasts only using an unbiased methodology and our articles are not intended to be financial advice. It does not constitute a recommendation to buy or sell any stock, and does not take account of your objectives, or your financial situation. We aim to bring you long-term focused analysis driven by fundamental data. Note that our analysis may not factor in the latest price-sensitive company announcements or qualitative material. Simply Wall St has no position in any stocks mentioned.
About TSE:6844
Shindengen Electric ManufacturingLtd
Shindengen Electric Manufacturing Co.,Ltd.
Excellent balance sheet with reasonable growth potential.
Similar Companies
Market Insights

Advertisement
Community Narratives
The Next Phase of Energy Storage: How NeoVolta Is Tackling America’s Power Crunch
Fair Value US$7.50|35.1% undervalued
MA
Community Contributor
Why EnSilica is Worth Possibly 13x its Current Price
Fair Value UK£5.00|89.8% undervalued
DO
Community Contributor
M&A Activity, Industry Diversification & A Defense Contract Monopoly Will Push BWXT For Healthy Long-Term Growth
Fair Value US$220.00|15.2% undervalued
CL
Community Contributor
A case for Cassiar Gold Corp (TSXV: GLDC) to reach CAD$8-10 before 2030 (X30-37)
Fair Value CA$10.00|96.0% undervalued
AG
Community Contributor