Advertisement
- Japan
- /
- Semiconductors
- /
- TSE:6526
A Look at Socionext (TSE:6526) Valuation Following Launch of Flexlets Configurable Chiplets

Simply Wall St
Reviewed by Simply Wall St
Socionext (TSE:6526) has unveiled its new Flexlets platform, an advanced series of configurable chiplets aimed at tackling industry-wide challenges in scalability and integration for next-generation semiconductor devices. This launch marks a move toward greater design flexibility and accelerated innovation within the chip industry.
See our latest analysis for Socionext.
Socionext’s push into customizable chiplets comes as momentum around the stock continues to build, with a 12.6% share price return year to date and an impressive 173.7% three year total shareholder return. The latest Flexlets launch, coupled with solid long-term gains, puts investor focus squarely on the company’s growth potential as the chip industry evolves rapidly.
If the buzz around advanced chiplet technology has you looking for more, consider broadening your search and discover See the full list for free.
Yet after such strong gains, the question remains: Is Socionext’s rapid rise justified by fundamentals, or is the market betting on even bigger growth ahead? Is there still a buying opportunity, or has the future already been priced in?
Price-to-Earnings of 40.6x: Is it justified?
Socionext currently trades at a price-to-earnings (P/E) ratio of 40.6x, which places its valuation at a premium to both its industry and its fair ratio benchmarks given the last closing price of ¥2,897.5.
The price-to-earnings ratio is a key metric indicating how much investors are willing to pay for each yen of earnings. For semiconductor companies like Socionext, a high P/E sometimes points to market optimism about future growth and profitability. However, it can also raise questions about whether expectations are getting ahead of the underlying fundamentals.
Socionext’s P/E ratio is more than double the industry average of 18.8x and considerably higher than the estimated fair P/E of 28.9x. This suggests that the market is pricing in rapid earnings growth, strong innovation, or competitive advantages well above its peers. If the company continues delivering substantial profit growth, this premium could be validated. However, if the growth slows, there could be significant downside pressure. The fair ratio of 28.9x indicates a level that valuations could return to if exuberance fades or sector dynamics shift.
Explore the SWS fair ratio for Socionext
Result: Price-to-Earnings of 40.6x (OVERVALUED)
However, any slowdown in global semiconductor demand or increased competition could quickly challenge Socionext’s premium valuation and disrupt its current growth momentum.
Find out about the key risks to this Socionext narrative.
Another View: DCF Model Suggests Undervaluation
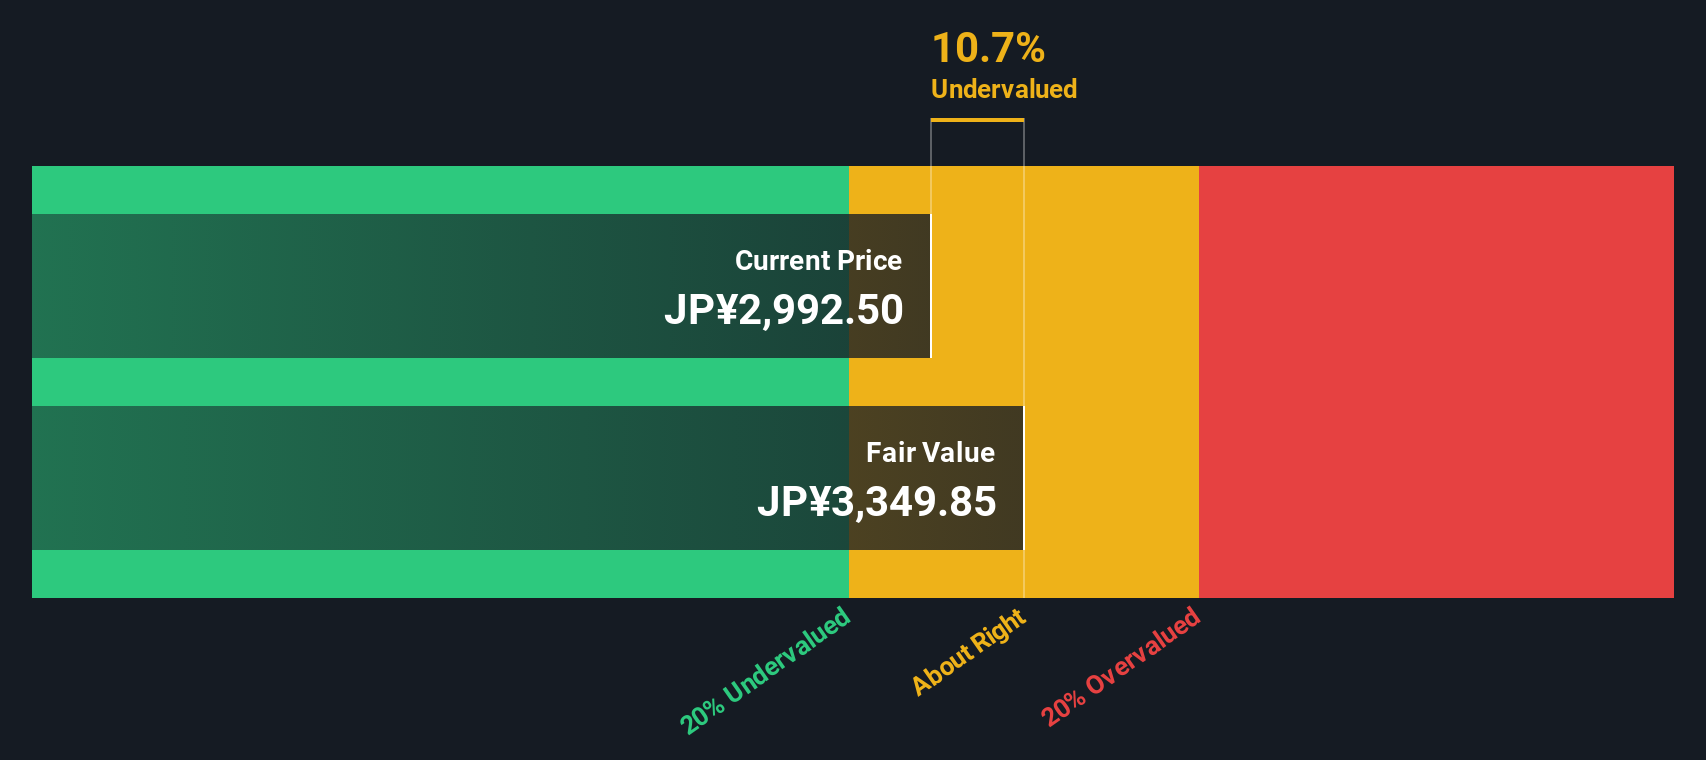
Taking a different angle with the SWS DCF model, Socionext's current share price of ¥2,897.5 is actually 13.9% below our estimated fair value of ¥3,366.79. This suggests that, despite lofty multiples, the shares might be undervalued if future cash flows deliver as forecasted. Could this divergence be an overlooked opportunity?
Look into how the SWS DCF model arrives at its fair value.
Simply Wall St performs a discounted cash flow (DCF) on every stock in the world every day (check out Socionext for example). We show the entire calculation in full. You can track the result in your watchlist or portfolio and be alerted when this changes, or use our stock screener to discover undervalued stocks based on their cash flows. If you save a screener we even alert you when new companies match - so you never miss a potential opportunity.
Build Your Own Socionext Narrative
If these perspectives do not align with your own analysis, or if you prefer taking a hands-on approach with the numbers, you can build your own research-backed view in just a few minutes. Do it your way
A great starting point for your Socionext research is our analysis highlighting 2 key rewards and 2 important warning signs that could impact your investment decision.
Looking for more investment ideas?
Smart investors never settle for just one opportunity. Open up your portfolio to fast-growing trends and overlooked value opportunities by using the right tools at your fingertips.
- Accelerate your search for opportunities in digital finance by checking out these 80 cryptocurrency and blockchain stocks focused on companies powering the evolution of blockchain and cryptocurrency sectors.
- Unlock tomorrow’s medical breakthroughs by scanning these 34 healthcare AI stocks for firms merging artificial intelligence with cutting-edge healthcare to revolutionize patient care.
- Tap into hidden bargains and strong cash-flow potential by browsing these 870 undervalued stocks based on cash flows, highlighting stocks trading below what their fundamentals suggest they are truly worth.
This article by Simply Wall St is general in nature. We provide commentary based on historical data and analyst forecasts only using an unbiased methodology and our articles are not intended to be financial advice. It does not constitute a recommendation to buy or sell any stock, and does not take account of your objectives, or your financial situation. We aim to bring you long-term focused analysis driven by fundamental data. Note that our analysis may not factor in the latest price-sensitive company announcements or qualitative material. Simply Wall St has no position in any stocks mentioned.
New: Manage All Your Stock Portfolios in One Place
We've created the ultimate portfolio companion for stock investors, and it's free.
• Connect an unlimited number of Portfolios and see your total in one currency
• Be alerted to new Warning Signs or Risks via email or mobile
• Track the Fair Value of your stocks
Have feedback on this article? Concerned about the content? Get in touch with us directly. Alternatively, email editorial-team@simplywallst.com
About TSE:6526
Socionext
Designs, develops, manufactures, and sells system-on-chip (SoC), and solutions/services centering on SoC worldwide.
Flawless balance sheet with reasonable growth potential.
Similar Companies
Market Insights

Advertisement
Community Narratives
The company that turned a verb into a global necessity and basically runs the modern internet, digital ads, smartphones, maps, and AI.
Fair Value US$300.00|10.2% undervalued
OS
Community Contributor
Flowers Foods Pays A Fair Price For Health
Fair Value US$16.12|20.3% undervalued
NV
Community Contributor
TMX Group will thrive with 33.3% profit margin and enduring market moat
Fair Value CA$49.90|0.1% undervalued
LI
Community Contributor