Advertisement
- Japan
- /
- Specialty Stores
- /
- TSE:9831
Yamada Holdings (TSE:9831): How Does Its Valuation Stack Up After a Quiet Share Price Move?

Simply Wall St
Reviewed by Simply Wall St
Yamada Holdings (TSE:9831) has caught the eye of investors today, as the stock recorded a small move higher in quiet trading. While there was no major corporate announcement or industry development driving this change, any shift in price, especially without headline news, can prompt investors to question whether the market is identifying something beneath the surface. Should we treat today’s movement as just noise, or is it the start of a bigger story?
Looking back over the year, Yamada Holdings’ stock has managed steady growth with a 16% gain over the past 12 months and a 12% bump over the past three months. While both revenue and net income advanced in the recent year, there have been no major surprises or setbacks in company updates. This relatively consistent performance has built a base of positive momentum, though it has not drastically changed the stock’s standing in the retail sector.
Is this latest price move a subtle buying signal, or has the market already factored in all the growth prospects for Yamada Holdings? Let’s dig deeper into what the numbers suggest.
Price-to-Earnings of 12.8x: Is it justified?
Based on the preferred multiple approach, Yamada Holdings currently trades with a price-to-earnings (P/E) ratio of 12.8x. This figure is noticeably lower than the average P/E ratio for both its industry peers (15.7x) and the broader Japanese market (14.7x). This comparison indicates the stock appears undervalued on this metric when compared to similar companies.
The price-to-earnings ratio is commonly used to assess how much investors are willing to pay for a company's earnings. It is particularly relevant for specialty retailers like Yamada Holdings, as it provides a benchmark against which to measure profitability and growth expectations within the same sector.
With Yamada Holdings trading at a discount to its peer group and the general market, investors may be underestimating the company’s recent earnings growth and current performance. This lower multiple could reflect caution about future growth, but it also signals an opportunity for value-seeking investors who believe the business can sustain or accelerate its improvements.
Result: Fair Value of ¥494.8 (ABOUT RIGHT)
See our latest analysis for Yamada Holdings.However, slowing revenue growth or a shift in consumer electronics demand could quickly challenge Yamada Holdings’ current valuation story.
Find out about the key risks to this Yamada Holdings narrative.Another View: Discounted Cash Flow Tells a Different Story
Taking a step back from earnings multiples, our DCF model points to a different conclusion. It suggests the stock may be priced higher than its future cash flows justify. Could this valuation gap signal risk for investors or hint at hidden strengths?
Look into how the SWS DCF model arrives at its fair value.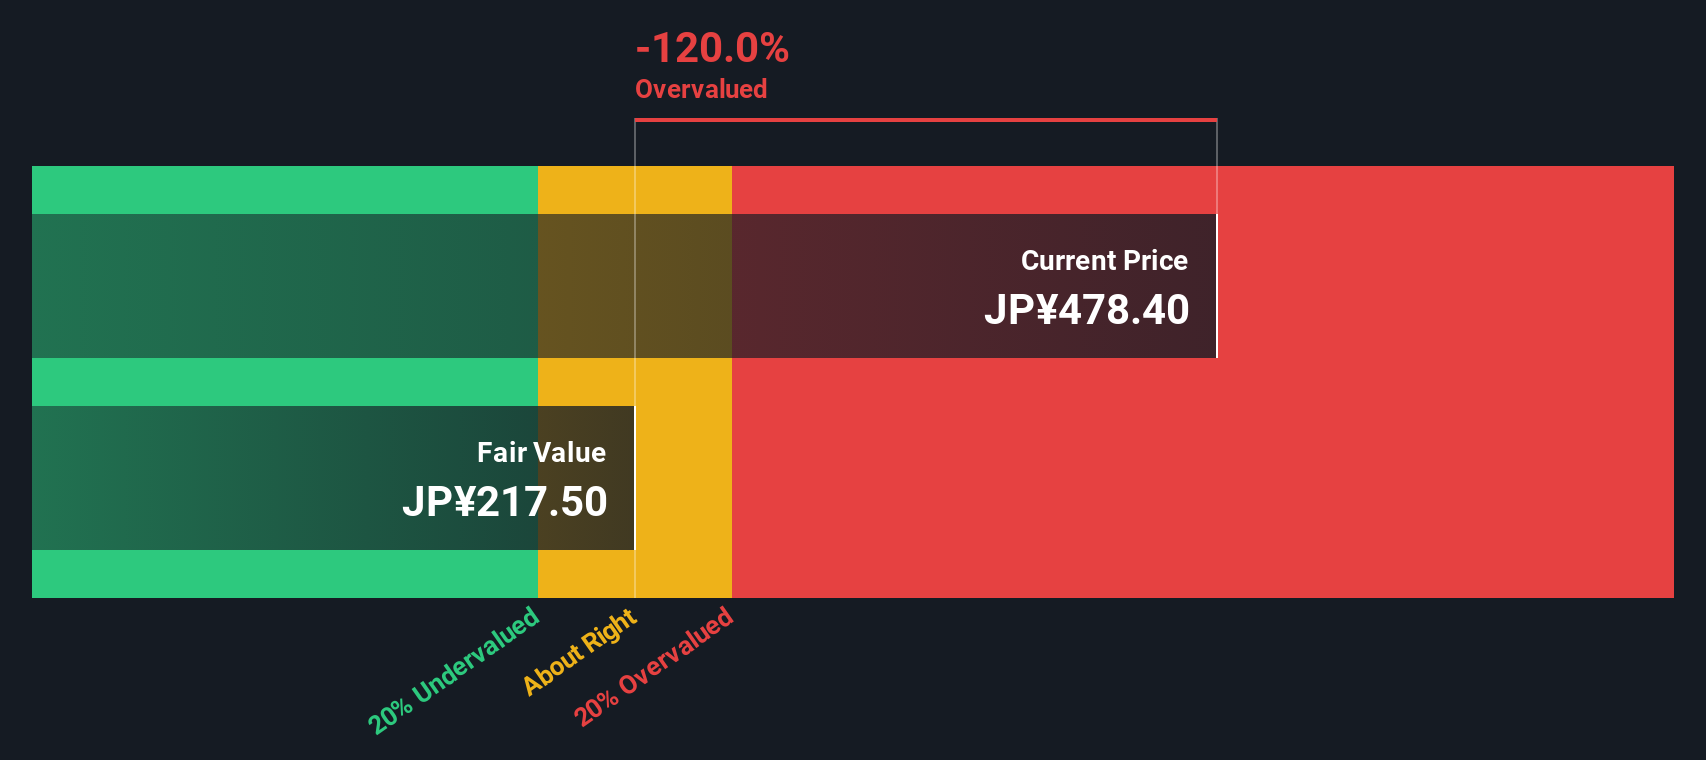
Build Your Own Yamada Holdings Narrative
If you see things differently, or want to look into the numbers on your own terms, you can craft your own outlook in just a few minutes. Do it your way.
A great starting point for your Yamada Holdings research is our analysis highlighting 4 key rewards and 2 important warning signs that could impact your investment decision.
Looking for more investment ideas?
Great thinking doesn’t stop here. Don’t let other smart opportunities pass you by when there’s a world of fresh investment angles waiting for you. Use these tailored lists to confidently find stocks that match your ambitions.
- Unlock cash-flow bargains and zero in on real value by checking out today’s opportunities with undervalued stocks based on cash flows.
- Tap into the future of medicine by seeing which companies are driving healthcare breakthroughs with healthcare AI stocks.
- Start building your income portfolio by pinpointing shares offering robust yields through dividend stocks with yields > 3%.
This article by Simply Wall St is general in nature. We provide commentary based on historical data and analyst forecasts only using an unbiased methodology and our articles are not intended to be financial advice. It does not constitute a recommendation to buy or sell any stock, and does not take account of your objectives, or your financial situation. We aim to bring you long-term focused analysis driven by fundamental data. Note that our analysis may not factor in the latest price-sensitive company announcements or qualitative material. Simply Wall St has no position in any stocks mentioned.
New: Manage All Your Stock Portfolios in One Place
We've created the ultimate portfolio companion for stock investors, and it's free.
• Connect an unlimited number of Portfolios and see your total in one currency
• Be alerted to new Warning Signs or Risks via email or mobile
• Track the Fair Value of your stocks
Have feedback on this article? Concerned about the content? Get in touch with us directly. Alternatively, email editorial-team@simplywallst.com
About TSE:9831
Yamada Holdings
Operates in the consumer electronics retailing activities in Japan and internationally.
Proven track record and fair value.
Similar Companies
Market Insights

Advertisement
Community Narratives
Quality at a Premium. A time to watch, not to buy?
Fair Value US$154.56|27.6% undervalued
DA
Community Contributor
GRAB: The Super-App at the Heart of Southeast Asia’s Digital Boom
Fair Value US$8.20|22.1% undervalued
BL
Community Contributor
Verve Group to Surge with 51.61% Revenue Growth
Fair Value €6.00|60.0% undervalued
ME
Community Contributor