- Japan
- /
- Specialty Stores
- /
- TSE:9270
With A 28% Price Drop For Valuence Holdings Inc. (TSE:9270) You'll Still Get What You Pay For


The Valuence Holdings Inc. (TSE:9270) share price has fared very poorly over the last month, falling by a substantial 28%. For any long-term shareholders, the last month ends a year to forget by locking in a 61% share price decline.
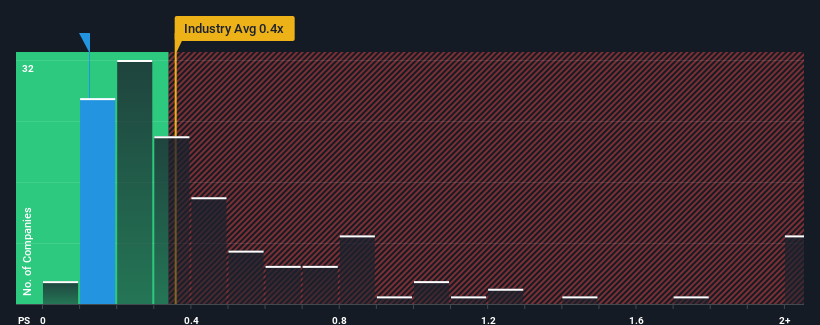
Although its price has dipped substantially, it's still not a stretch to say that Valuence Holdings' price-to-sales (or "P/S") ratio of 0.1x right now seems quite "middle-of-the-road" compared to the Specialty Retail industry in Japan, where the median P/S ratio is around 0.4x. While this might not raise any eyebrows, if the P/S ratio is not justified investors could be missing out on a potential opportunity or ignoring looming disappointment.
See our latest analysis for Valuence Holdings
What Does Valuence Holdings' P/S Mean For Shareholders?
Recent times have been advantageous for Valuence Holdings as its revenues have been rising faster than most other companies. It might be that many expect the strong revenue performance to wane, which has kept the P/S ratio from rising. If you like the company, you'd be hoping this isn't the case so that you could potentially pick up some stock while it's not quite in favour.
Want the full picture on analyst estimates for the company? Then our free report on Valuence Holdings will help you uncover what's on the horizon.Is There Some Revenue Growth Forecasted For Valuence Holdings?
Valuence Holdings' P/S ratio would be typical for a company that's only expected to deliver moderate growth, and importantly, perform in line with the industry.
Retrospectively, the last year delivered an exceptional 16% gain to the company's top line. The strong recent performance means it was also able to grow revenue by 98% in total over the last three years. Accordingly, shareholders would have definitely welcomed those medium-term rates of revenue growth.
Shifting to the future, estimates from the sole analyst covering the company suggest revenue should grow by 6.9% per year over the next three years. Meanwhile, the rest of the industry is forecast to expand by 7.6% per annum, which is not materially different.
With this in mind, it makes sense that Valuence Holdings' P/S is closely matching its industry peers. It seems most investors are expecting to see average future growth and are only willing to pay a moderate amount for the stock.
What Does Valuence Holdings' P/S Mean For Investors?
Valuence Holdings' plummeting stock price has brought its P/S back to a similar region as the rest of the industry. Typically, we'd caution against reading too much into price-to-sales ratios when settling on investment decisions, though it can reveal plenty about what other market participants think about the company.
Our look at Valuence Holdings' revenue growth estimates show that its P/S is about what we expect, as both metrics follow closely with the industry averages. Right now shareholders are comfortable with the P/S as they are quite confident future revenue won't throw up any surprises. If all things remain constant, the possibility of a drastic share price movement remains fairly remote.
There are also other vital risk factors to consider and we've discovered 3 warning signs for Valuence Holdings (2 shouldn't be ignored!) that you should be aware of before investing here.
If strong companies turning a profit tickle your fancy, then you'll want to check out this free list of interesting companies that trade on a low P/E (but have proven they can grow earnings).
If you're looking to trade Valuence Holdings, open an account with the lowest-cost platform trusted by professionals, Interactive Brokers.
With clients in over 200 countries and territories, and access to 160 markets, IBKR lets you trade stocks, options, futures, forex, bonds and funds from a single integrated account.
Enjoy no hidden fees, no account minimums, and FX conversion rates as low as 0.03%, far better than what most brokers offer.
Sponsored ContentNew: Manage All Your Stock Portfolios in One Place
We've created the ultimate portfolio companion for stock investors, and it's free.
• Connect an unlimited number of Portfolios and see your total in one currency
• Be alerted to new Warning Signs or Risks via email or mobile
• Track the Fair Value of your stocks
Have feedback on this article? Concerned about the content? Get in touch with us directly. Alternatively, email editorial-team (at) simplywallst.com.
This article by Simply Wall St is general in nature. We provide commentary based on historical data and analyst forecasts only using an unbiased methodology and our articles are not intended to be financial advice. It does not constitute a recommendation to buy or sell any stock, and does not take account of your objectives, or your financial situation. We aim to bring you long-term focused analysis driven by fundamental data. Note that our analysis may not factor in the latest price-sensitive company announcements or qualitative material. Simply Wall St has no position in any stocks mentioned.
About TSE:9270
Valuence Holdings
Engages in the purchase, auction, and sale of reused goods in Japan and internationally.
Good value with reasonable growth potential.
Market Insights

Community Narratives

