
Advertisement
Key Insights
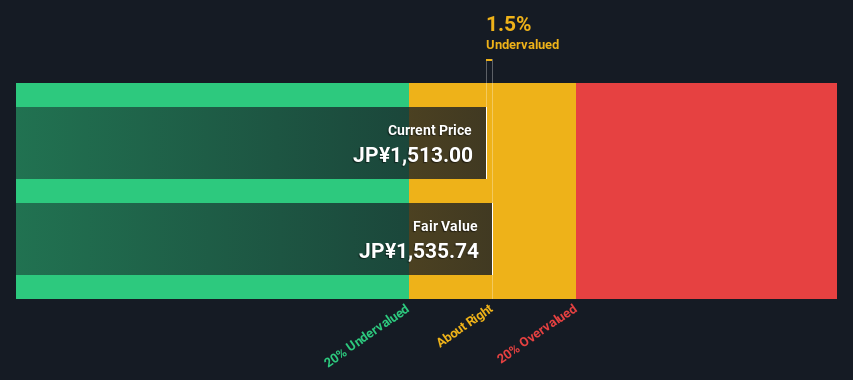
- The projected fair value for K's Holdings is JP¥1,536 based on 2 Stage Free Cash Flow to Equity
- K's Holdings' JP¥1,513 share price indicates it is trading at similar levels as its fair value estimate
- Our fair value estimate is 3.1% lower than K's Holdings' analyst price target of JP¥1,585
Today we will run through one way of estimating the intrinsic value of K's Holdings Corporation (TSE:8282) by taking the expected future cash flows and discounting them to their present value. We will use the Discounted Cash Flow (DCF) model on this occasion. Believe it or not, it's not too difficult to follow, as you'll see from our example!
Remember though, that there are many ways to estimate a company's value, and a DCF is just one method. If you still have some burning questions about this type of valuation, take a look at the Simply Wall St analysis model.
View our latest analysis for K's Holdings
Is K's Holdings Fairly Valued?
We're using the 2-stage growth model, which simply means we take in account two stages of company's growth. In the initial period the company may have a higher growth rate and the second stage is usually assumed to have a stable growth rate. To start off with, we need to estimate the next ten years of cash flows. Where possible we use analyst estimates, but when these aren't available we extrapolate the previous free cash flow (FCF) from the last estimate or reported value. We assume companies with shrinking free cash flow will slow their rate of shrinkage, and that companies with growing free cash flow will see their growth rate slow, over this period. We do this to reflect that growth tends to slow more in the early years than it does in later years.
Generally we assume that a dollar today is more valuable than a dollar in the future, and so the sum of these future cash flows is then discounted to today's value:
10-year free cash flow (FCF) forecast
| 2025 | 2026 | 2027 | 2028 | 2029 | 2030 | 2031 | 2032 | 2033 | 2034 | |
| Levered FCF (¥, Millions) | JP¥21.7b | JP¥12.9b | JP¥14.1b | JP¥13.7b | JP¥14.0b | JP¥14.2b | JP¥14.4b | JP¥14.5b | JP¥14.6b | JP¥14.7b |
| Growth Rate Estimate Source | Analyst x2 | Analyst x4 | Analyst x4 | Analyst x1 | Analyst x1 | Est @ 1.47% | Est @ 1.11% | Est @ 0.85% | Est @ 0.68% | Est @ 0.55% |
| Present Value (¥, Millions) Discounted @ 5.9% | JP¥20.4k | JP¥11.5k | JP¥11.9k | JP¥10.9k | JP¥10.5k | JP¥10.1k | JP¥9.6k | JP¥9.2k | JP¥8.7k | JP¥8.3k |
("Est" = FCF growth rate estimated by Simply Wall St)
Present Value of 10-year Cash Flow (PVCF) = JP¥111b
The second stage is also known as Terminal Value, this is the business's cash flow after the first stage. The Gordon Growth formula is used to calculate Terminal Value at a future annual growth rate equal to the 5-year average of the 10-year government bond yield of 0.3%. We discount the terminal cash flows to today's value at a cost of equity of 5.9%.
Terminal Value (TV)= FCF2034 × (1 + g) ÷ (r – g) = JP¥15b× (1 + 0.3%) ÷ (5.9%– 0.3%) = JP¥261b
Present Value of Terminal Value (PVTV)= TV / (1 + r)10= JP¥261b÷ ( 1 + 5.9%)10= JP¥147b
The total value is the sum of cash flows for the next ten years plus the discounted terminal value, which results in the Total Equity Value, which in this case is JP¥258b. In the final step we divide the equity value by the number of shares outstanding. Compared to the current share price of JP¥1.5k, the company appears about fair value at a 1.5% discount to where the stock price trades currently. Valuations are imprecise instruments though, rather like a telescope - move a few degrees and end up in a different galaxy. Do keep this in mind.
The Assumptions
The calculation above is very dependent on two assumptions. The first is the discount rate and the other is the cash flows. Part of investing is coming up with your own evaluation of a company's future performance, so try the calculation yourself and check your own assumptions. The DCF also does not consider the possible cyclicality of an industry, or a company's future capital requirements, so it does not give a full picture of a company's potential performance. Given that we are looking at K's Holdings as potential shareholders, the cost of equity is used as the discount rate, rather than the cost of capital (or weighted average cost of capital, WACC) which accounts for debt. In this calculation we've used 5.9%, which is based on a levered beta of 1.133. Beta is a measure of a stock's volatility, compared to the market as a whole. We get our beta from the industry average beta of globally comparable companies, with an imposed limit between 0.8 and 2.0, which is a reasonable range for a stable business.
SWOT Analysis for K's Holdings
Strength
- Debt is not viewed as a risk.
Weakness
- Earnings declined over the past year.
- Dividend is low compared to the top 25% of dividend payers in the Specialty Retail market.
Opportunity
- Annual earnings are forecast to grow faster than the Japanese market.
- Current share price is below our estimate of fair value.
Threat
- Dividends are not covered by earnings.
- Annual revenue is forecast to grow slower than the Japanese market.
Moving On:
Although the valuation of a company is important, it shouldn't be the only metric you look at when researching a company. It's not possible to obtain a foolproof valuation with a DCF model. Rather it should be seen as a guide to "what assumptions need to be true for this stock to be under/overvalued?" If a company grows at a different rate, or if its cost of equity or risk free rate changes sharply, the output can look very different. For K's Holdings, we've compiled three relevant elements you should look at:
- Risks: We feel that you should assess the 3 warning signs for K's Holdings we've flagged before making an investment in the company.
- Future Earnings: How does 8282's growth rate compare to its peers and the wider market? Dig deeper into the analyst consensus number for the upcoming years by interacting with our free analyst growth expectation chart.
- Other High Quality Alternatives: Do you like a good all-rounder? Explore our interactive list of high quality stocks to get an idea of what else is out there you may be missing!
PS. The Simply Wall St app conducts a discounted cash flow valuation for every stock on the TSE every day. If you want to find the calculation for other stocks just search here.
Valuation is complex, but we're here to simplify it.
Discover if K's Holdings might be undervalued or overvalued with our detailed analysis, featuring fair value estimates, potential risks, dividends, insider trades, and its financial condition.
Access Free AnalysisHave feedback on this article? Concerned about the content? Get in touch with us directly. Alternatively, email editorial-team (at) simplywallst.com.
This article by Simply Wall St is general in nature. We provide commentary based on historical data and analyst forecasts only using an unbiased methodology and our articles are not intended to be financial advice. It does not constitute a recommendation to buy or sell any stock, and does not take account of your objectives, or your financial situation. We aim to bring you long-term focused analysis driven by fundamental data. Note that our analysis may not factor in the latest price-sensitive company announcements or qualitative material. Simply Wall St has no position in any stocks mentioned.
About TSE:8282
Excellent balance sheet established dividend payer.
Similar Companies
Market Insights

Advertisement
Community Narratives
The Next Phase of Energy Storage: How NeoVolta Is Tackling America’s Power Crunch
Fair Value US$7.50|35.1% undervalued
MA
Community Contributor
Why EnSilica is Worth Possibly 13x its Current Price
Fair Value UK£5.00|89.8% undervalued
DO
Community Contributor
M&A Activity, Industry Diversification & A Defense Contract Monopoly Will Push BWXT For Healthy Long-Term Growth
Fair Value US$220.00|15.2% undervalued
CL
Community Contributor
A case for Cassiar Gold Corp (TSXV: GLDC) to reach CAD$8-10 before 2030 (X30-37)
Fair Value CA$10.00|96.0% undervalued
AG
Community Contributor